Principles for Dealing with
THE CHANGING
WORLD ORDER
RAY DALIO
© COPYRIGHT 2021
This PDF contains the charts and tables from the book for printing and easy reference.

1
THE CHANGING WORLD ORDER
1500 1600 1700 1800 1900 2000
Inflection during the
Industrial Revolution
Invention of
capitalism (founding
of Dutch Stock
Exchange)
Global real GDP is primarily a mix of European countries before 1870 due to limited
reliable data coverage across other countries before that point
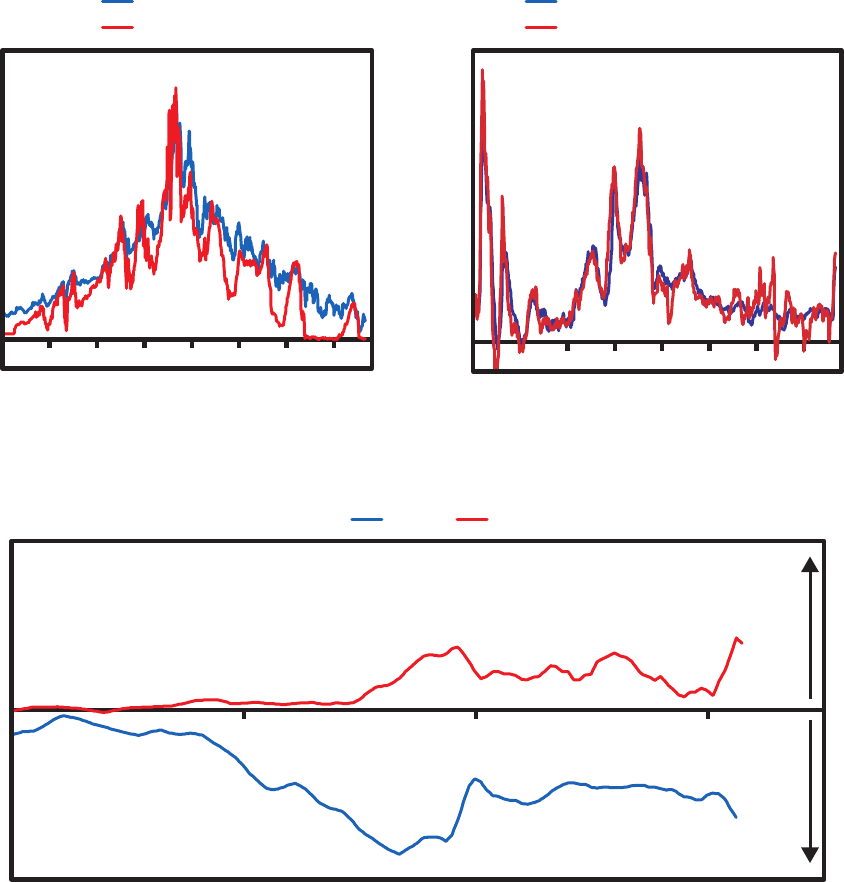
GLOBAL REAL GDP PER CAPITA (LOG)
7
8
9
10
11
0
10
20
30
40
50
60
70
80
1500 1600 1700 1800 1900 2000
Baby
Boom
WWII
WWI,
Spanish flu
pandemic
Thirty Years’ War
Third Plague
pandemic
COVID-19
1557 influenza
pandemic
Flu outbreak
& famine
Dashed line based on experience of Great Britain only
GLOBAL LIFE EXPECTANCY AT BIRTH
CHAPTER 1
THE BIG CYCLE
IN A TINY NUTSHELL

2
THE CHANGING WORLD ORDER
0
100
200
300
400
1500 1600 1700 1800 1900 2000
War of the
Spanish
Succession
Napoleonic
Wars
World
War I
World
War II
Spanish flu
HIV/
AIDS
Indian
and
Chinese
famines
China’s
Great Leap
Forward
Series of Indian
famines
Cocoliztli
epidemics
Thirty Years’ War,
fall of Ming Dynasty,
Indian famine
GLOBAL DEATHS BY CATEGORY (RATE PER 100K PEOPLE, 15YMA)
Conflicts Natural Disasters Pandemics Famines
COVID-19

3
THE CHANGING WORLD ORDER
ESTIMATED DEATHS FROM CONFLICT
(MAJOR POWERS, %POPULATION, 15YMA)
Internal Conflict External Conflict Total
0.0%
0.1%
0.2%
0.3%
0.4%
0.5%
1400 1500 1600 1700 1800 1900 2000
Collapse of Ming Dynasty,
religious wars in Europe
Based on deaths as a share of the population for the major powers and thus will differ
from the estimate of global conflict deaths shown in the prior chart
Chinese
border
wars,
religious
wars in
Europe
Wars of
Religion in
France
Time of
Troubles in
Russia
European
monarchic
wars
Seven
Years’ War
in Europe
Napoleonic
Wars
Ethnic wars
in China
WWI
WWII, Holocaust,
communist revolutions
Global RGDP Per Capita (2017 USD, Log) USA Equities Cumulative Return
0
20
40
60
80
100
120
140
160
8.50
8.60
8.70
8.80
1929 1931 1933 1935 1937 1939 1941 1943 1945
~10% fall
~12% fall

4
THE CHANGING WORLD ORDER
0
1
1500 1600 1700 1800 1900 2000
Level Relative to Other Empires (1 = All-Time Max)
RELATIVE STANDING OF GREAT EMPIRES
FranceGermanySpainNetherlands
Ottoman EmpireJapanIndia
United KingdomChinaUnited StatesMajor Wars
Russia
United States
United Kingdom
Netherlands
China

5
THE CHANGING WORLD ORDER
0
1
-120 -80 -40 0408
01
20
Level Relative to Peak (1 = Peak)
Years (0 = Empire Peak)
THE ARCHETYPICAL RISE AND DECLINE BY DETERMINANT
Education Innovation and Technology Competitiveness Military
Trade Economic Output Financial Center Reserve FX Status
THE TOP
THE DECLINETHE RISE
New Orde
rN
ew Order

6
THE CHANGING WORLD ORDER
New Orde
rN
ew Order
Less productive
Overextended
Losing competitiveness
Wealth gaps
Strong leadership
Inventiveness
Education
Strong culture
Good resource allocation
Good competitiveness
Strong income growth
Strong markets and
financial centers
Large debts
Printing money
Internal conflict
Loss of reserve
currency
Weak leadership
Civil war/revolution
13
14
17
18
9
10
1
2
3
4
5
6
7
8
THE TOP
THE DECLINETHE RISE
11
12
15
16
9
11
12
10
13
15
14
16
18
17
1
2
3
4
5
6
8
7
7
THE CHANGING WORLD ORDER
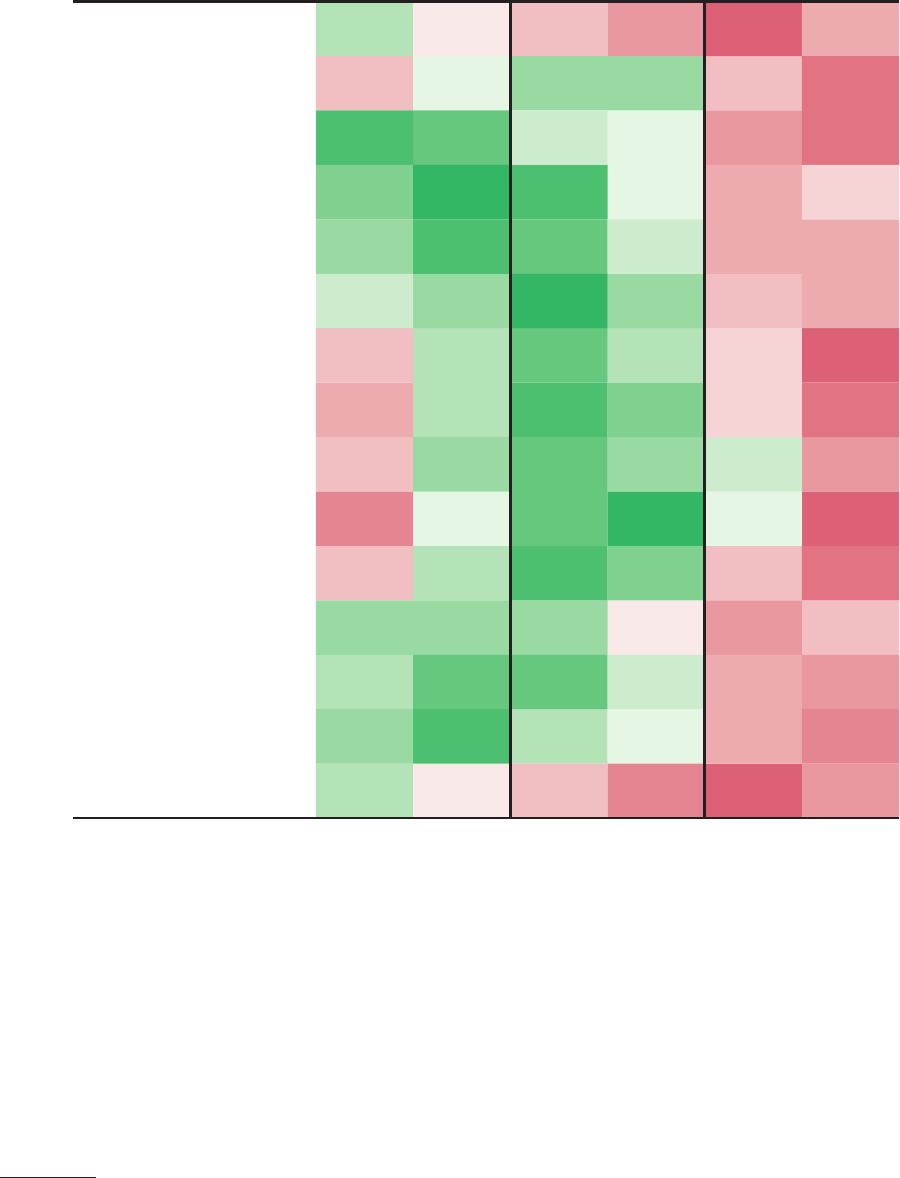
ROUGH QUANTITATIVE SCORING OF
MEASURES BY STAGE IN CYCLE
THE RISE THE TOP THE DECLINE
Debt Burden
(Big Economic Cycle)
Internal Conflict
(Internal Order Cycle)
Education
Innovation & Technology
Cost Competitiveness
Military Strength
Trade
Economic Output
Markets & Financial Center
Reserve Currency Status
Resource-Allocation Effi-
ciency
Infrastructure & Investment
Character/Civility/
Determination
Governance/Rule of Law
Gaps in Wealth,
Opportunity & Values
Dark green = gauge is strong/good
Dark red = gauge is weak/bad
1
1
Acts of nature, external order, and geology are not included in cycle analysis. Readings use proxies for determinants with limited history.

8
THE CHANGING WORLD ORDER
Relative Power
Time
New
World
Order
New
World
Order
United StatesUnited Kingdom
Netherlands
China
CHANGES TO THE WORLD ORDER (CONCEPTUAL EXAMPLE)
End of the Old,
Beginning of the New
(e.g., Dutch to British)
End of the Old,
Beginning of the New
(e.g., British to US)
■
Debt restructuring and debt
crisis
■
Internal revolution (peaceful
or violent) that leads to large
transfers of wealth from the
“haves” to the “have-nots”
■
External war
■
Big currency breakdown
■
New domestic and world
order
■
Debt restructuring and debt
crisis
■
Internal revolution (peaceful
or violent) that leads to large
transfers of wealth from the
“haves” to the “have-nots”
■
External war
■
Big currency breakdown
■
New domestic and world
order
9
THE CHANGING WORLD ORDER
How the Machine Works = (f)…
Case
1
Case
2
Case
3
Case
4
Case
5
Case
6
Case
7
Case
8
Case
9
Case 10,
Etc
Determinant 1 Effect Effect Effect Effect Effect Effect Effect Effect Effect Effect
Determinant 2 Effect Effect Effect Effect Effect Effect Effect Effect Effect Effect
Determinant 3 Effect Effect Effect Effect Effect Effect Effect Effect Effect Effect
Determinant 4 Effect Effect Effect Effect Effect Effect Effect Effect Effect Effect
Determinant 5 Effect Effect Effect Effect Effect Effect Effect Effect Effect Effect
Determinant 6 Effect Effect Effect Effect Effect Effect Effect Effect Effect Effect
Determinant 7 Effect Effect Effect Effect Effect Effect Effect Effect Effect Effect
Determinant 8 Effect Effect Effect Effect Effect Effect Effect Effect Effect Effect
Determinant 9 Effect Effect Effect Effect Effect Effect Effect Effect Effect Effect
Determinant 10 Effect Effect Effect Effect Effect Effect Effect Effect Effect Effect
Etc
CHAPTER 2
THE DETERMINANTS

10
THE CHANGING WORLD ORDER
Big Debt/Money/Capital Markets/Economic Cycle
THE THREE BIG CYCLES
Geology
ADDITIONAL DETERMINANTS
Education
OTHER KEY DETERMINANTS (EIGHT KEY MEASURES OF POWER)
Big Cycle of Internal Order and Disorder
Big Cycle of External Order and Disorder
Innovation & Technology
Cost Competitiveness
Military Strength
Trade
Economic Output
Markets and Financial Center
Reserve Currency Status
Resource-Allocation Efficiency
Acts of Nature
Unhealthy
Disorder
War
Low
Low
Weak
Weak
Unfavorable
Low
Weak
Weak
Unfavorable
Poor
Disruptive
Healthy
Order
Peace
High
High
Strong
Strong
Favorable
High
Strong
Strong
Favorable
Efficient
Beneficial
Infrastructure and Investment
Character/Civility/Determination
Governance/Rule of Law
Low
Weak
Weak
High
Strong
Strong
Gaps in Wealth, Opportunity & Values
Large
Small

11
THE CHANGING WORLD ORDER
DYNAMICS TO PAY ATTENTION TO
Self-Interest
Desire to Gain Wealth and Power
Learning from History
Multigenerational Psychological Cycle
Time Frame of Decision Making
Individual
Not important
Limited
Decadent
Short-Term
Country
Important
Extensive
Strong
Long-Term
Leadership
Weak
Competent
Openness to Global Thinking
Culture
Class Relationships
Closed
Unproductive
Divisive
Open
Productive
Cooperative
Political Left/Right
Prisoner’s Dilemma
Relationships
Partisan
At War
Lose-Lose
Moderate
Cooperative
Win-Win
Balance of Power
Peace/War Cycle
Unfavorable
War
Favorable
Peace

12
THE CHANGING WORLD ORDER
THE UNIVERSE
COUNTRY
STATE
EMPIRE
HUMANKIND
ALL LIVING THINGS
TRIBE
(i.e., community)
INDIVIDUAL
FAMILY
CHAPTER 2
DETERMINANTS ADDENDUM

13
THE CHANGING WORLD ORDER
Type 3: Fiat Money
(e.g., USD Today)
Maximizes Credit,
Minimizes Credibility
Type 1: Hard Money
(e.g., Metal Coins)
Maximizes Credibility,
Minimizes Credit
Type 2: Claims on Hard Money
(e.g., Banknotes)
Expands Credit,
Compromises Credibility
CHAPTER 3
THE BIG CYCLE OF MONEY,
CREDIT, DEBT, AND
ECONOMIC ACTIVITY

14
THE CHANGING WORLD ORDER
0%
20%
40%
60%
80%
100%
RESERVE CURRENCIES VS GOLD (SPOT FX)
NLD GBR USA
Dutch Empire ends/
collapse of Bank of
Amsterdam
US
Civil War
Great Depression
Inflationary
’70s
WWI
WWII
War of
1812
Napoleonic
Wars
1600 1700 1800 1900 2000
-100%
-80%
-60%
-40%
-20%
0%
20%
40%
1860 1880 1900 1920 1940 1960 1980 2000 2020
SPOT FX VS GOLD
USA GBR DEU FRA ITA
JPN CHE ESP NLD CHN
(1)
(2)
(3)
(5)
(6)
(4)
CHAPTER 4
THE CHANGING
VALUE OF MONEY

15
THE CHANGING WORLD ORDER
2
1
10
100
1,000
10,000
1850 1870 1890 1910 1930 1950 1970 1990 2010 2030
FX TOTAL RETURN VS GOLD (LOG)
ITAUSA GBR DEU FRA
JPN CHEESP NLD
-60%
-40%
-20%
0%
20%
1850 1860 1870 1880 1890 1900 1910
SPOT FX VS GOLD (1850–1913)
ITAUSA GBR DEU FRA
JPN CHE ESP NLD
Broad stability
US Civil War
Falling silver
prices produce
Japanese devaluation
Fiscal crisis
in Spain
2
Due to a lack of data, several charts in this chapter do not show China.
16
THE CHANGING WORLD ORDER
-100%
0%
100%
200%
SPOT FX VS GOLD (1913–1930)
USA GBR DEU FRA ITA
JPN CHE ESP NLD CHN
Post-WWI devaluations
and German hyperinflation
Broad stability
during 1920s
1913 1915 1917 1919 1923 1925 1927 19291921
-100%
-80%
-60%
-40%
-20%
0%
20%
SPOT FX VS GOLD (1930–1950)
USA GBR DEU FRA ITA
JPN CHE ESP NLD CHN
1930 1935 1940 1945 1950
DEU FX restructured in 1948,
effectively confiscating
nearly all financial wealth
17
THE CHANGING WORLD ORDER
-100%
-80%
-60%
-40%
-20%
0%
20%
19681966 1970 1972 1974 1976
SPOT FX VS GOLD (1966–1977)
USA GBR DEU FRA ITA
JPN CHE ESP NLD CHN
End of Bretton Woods
-100%
-50%
0%
50%
98 02 06 10 14 2218
-4%
-2%
0%
2%
4%
6%
REAL LONG RATES
(1998–PRESENT)
SPOT FX VS GOLD
(1998–PRESENT)
98 02 06 10 14 18
USA GBR DEU FRA ITA
JPN CHE ESP NLD CHN

18
THE CHANGING WORLD ORDER
CURRENCY AND GOLD REAL RETURNS OF MAJOR COUNTRIES
SINCE 1850 (VS CPI, ANN)
Country
Real Returns (vs CPI), Ann
1850–Present 1850–1912 1912–Present
Continuous
Govt Bill
Investment
Gold
Continuous
Govt Bill
Investment
Gold
Continuous
Govt Bill
Investment
Gold
United Kingdom 1.4% 0.7% 3.1% -0.1% 0.5% 1.1%
United States 1.6% 0.3% 3.6% -1.0% 0.4% 1.0%
Germany -12.9% 2.0% 3.0% -0.9% -18.2% 3.1%
France -0.7% 0.6% 2.6% -0.3% -2.6% 1.1%
Italy -0.6% 0.3% 4.7% -0.5% -2.6% 0.5%
Japan -0.7% 1.0% 5.0% 0.4% -2.2% 1.2%
Switzerland 1.5% 0.0% 3.4% -0.5% 0.5% 0.3%
Spain 1.4% 1.1% 4.5% 0.1% 0.3% 1.5%
Netherlands 1.4% 0.5% 3.3% 0.0% 0.4% 0.7%
China — 3.3% — — — 3.3%
Average 1.2% 0.9% 3.6% -0.3% -0.1% 1.6%
Data for Switzerland is since 1851; data for Germany, Spain, and Italy is since 1870; data
for Japan is since 1882; data for China is since 1926 (excluding 1948–50). Average return is
un-rebalanced and doesn’t include China.
10
100
1,000
10,000
REAL RETURN OF GOLD (VS CPI, LOG)
USA GBR DEU FRA ITA
JPN CHE ESP NLD CHN
1860 1880 1900 1920 1940 1960 1980 2000 2020

19
THE CHANGING WORLD ORDER
1850 1870 1890 1910 1930 1950 1970 1990 2010 2030
0
4
8
12
16
20
REAL RETURN OF BILLS (VS CPI)
ITAUSA GBR DEU FRA
JPN CHE ESP NLD

20
THE CHANGING WORLD ORDER
THE TOP
THE DECLINETHE RISE
CHN
USA
Peace and prosperity
Excesses and widening
of wealth and other gaps
New internal order
and new leadership
Resource-allocation
systems and government
bureaucracies are
built and refined
Bad financial
conditions and
intense conflicts
Civil wars and
revolutions
5
6
3
4
1
2
THE TOP
THE DECLINETHE RISE
3 4
2 5
61
1
2
3
4
5
6
1
2
3
4
5
6
1
2
3
4
5
6
1
2
3
4
5
6
1
2
3
4
5
61
4
1
2
3
5
6
2
3
4
5
6
CHAPTER 5
THE BIG CYCLE OF INTERNAL
ORDER AND DISORDER

21
THE CHANGING WORLD ORDER
MAJOR CHINESE DYNASTIES AND THEIR STAGES
(WITH INDICATIVE UPWARD EVOLUTION)
Tang
Dynasty
Ming
Dynasty
Qing
Dynasty
Song
Dynasty
Yuan
Dynasty
RC PRC
1000 1200 1400 1600 1800 2000600800
1
2
3
4
5
6
1
2
3
4
5
6
1
2
3
5
6
4
1
2
3
4
6
5
1
2
3
MAJOR CHINESE DYNASTIES AND THEIR STAGES
Tang
Dynasty
Ming
Dynasty
Qing
Dynasty
Song
Dynasty
Yuan
Dyn
RCPRC
1000 1200 1400 1600 1800 2000
0
1
Level Relative to Other Empires
(1 = All-Time Max)
600800
1
2
3
5
6
1
2
3
4
4
5
6
1
2
3
4
5
6
1
2
3
4
5
6
1
2
3

22
THE CHANGING WORLD ORDER
GLOBAL RGDP PER CAPITA (2017 USD, LOG)
1500 1600 1700 1800 1900 2000
7
8
9
10
11
Emergence
of German
Empire, 2nd
Industrial
Revolution
Panic
of 1873
Peak
of Qing
Dynasty
Invention
of printing
press
(1440)
Dutch
Revolt,
war with
Ottomans
Beginning
of capitalism
(Amsterdam
Stock
Exchange)
Thirty
Years’
War
Collapse
of Ming
Dynasty,
English
Civil War
2nd
Anglo-
Dutch
War
Taj
Mahal,
peak of
Mughal
Empire
Glorious
Revolution,
Great
Turkish
War
South
Sea
Bubble
Seven
Years’
War
American
Revolution
French
Revolution,
collapse of
Dutch Rep
Revolutions
of 1848
1st Industrial Revolution
Taiping
Rebellion,
2nd
Opium
War
Roaring
’20s
Peak of
American
Empire
Digital
Revolution
2008
crisis
Deng
Xiaoping
reforms
Meiji
Restoration
Great
Depression
World
War II
COVID-
19
Collapse
of Qing,
WWI, and
post-war
recession
Napoleonic Wars
Global RGDP is primarily a mix of European countries before 1870 due to limited
reliable data coverage across other countries before that point.

23
THE CHANGING WORLD ORDER
HISTORICAL LIKELIHOOD OF INTERNAL CONFLICT BASED ON SHARE OF
ECONOMIC MEASURES WORSE THAN THRESHOLD (>1Z)
12%
11%
17%
30%
<40% 40–60% 60–80% >80%
Likelihood of Conflict in Next 5 Years
Share of Economic Measures Worse Than Threshold (>1z)
As you go from fewer problems with economic measures to
problems across all measures, the risk of conflict nearly triples
0%
10%
20%
30%
40%
3
3
is chart is based on historical analysis of nine great powers (covering about 2,200 years of history in total). e likelihood of conflict is based on
major cases of civil war, rebellion, and revolution but excludes peaceful revolutions that did not change the existing system. e analysis does not
count the probability of conflict arising in a period when a country is already in the midst of internal conflict (and the five years following) to avoid
counting periods in which economic conditions were bad because of the conflict itself.

24
THE CHANGING WORLD ORDER
CONFLICT COUNTRY BEGAN IN…
Dutch Revolt NLD 1566
English Civil War GBR 1642
Glorious Revolution GBR 1688
American Revolution USA 1775
French Revolution FRA 1789
Cas
-
es that
created
changes
to the
system or
regime
Trienio Liberal ESP 1820
French Revolution of 1848 FRA 1848
Meiji Restoration JPN 1868
Xinhai Revolution CHN 1911
Russian Revolution and Civil War RUS 1917
German Revolution/End of Monarchy DEU 1918
Rise of Hitler/Political Violence DEU 1929
Rise of Japanese Militarists JPN 1932
Spanish Civil War ESP 1936
Chinese Civil War CHN 1945
Jacobite Risings GBR 1745
Pugachev’s Rebellion RUS 1773
Dutch Patriot Revolt NLD 1781
White Lotus Rebellion CHN 1794
German Revolutions of 1848 DEU 1848
Cases
that didn’t
create
changes
to the
system or
regime
Taiping Rebellion CHN 1851
Panthay Rebellion CHN 1856
US Civil War USA 1861
Muslim Rebellion CHN 1862
Paris Commune FRA 1871
Boxer Rebellion CHN 1899
1905 Russian Revolution RUS 1905
National Protection War CHN 1915
6 February 1934 Crisis FRA 1934

25
THE CHANGING WORLD ORDER
EST EUROPEAN DEATHS FROM CONFLICT
(%POP, 15YR MOVING AVG)
Internal Conflict External Conflict Total
0.0%
0.1%
0.2%
0.3%
0.4%
1400 1500 1600 1700 1800 1900 2000
Renaissance,
Age of
Exploration
Wars of Religion,
Thirty Years' War
Enlightenment,
capitalism,
Industrial
Revolution
Napoleonic
Wars
World
Wars
Pax
Britannica,
Second
Industrial
Revolution
EU
integr-
ation
CHAPTER 6
THE BIG CYCLE OF EXTERNAL
ORDER AND DISORDER

26
THE CHANGING WORLD ORDER
DEU EQUITY RETURNS
(LOCAL FX,
CUMULATIVE EXCESS)
DEU PER CAPITA INCOME
(2017 USD)
1933 1935 1937 1939 1933 1935 1937 1939
5,500
6,500
7,500
8,500
-20%
0%
20%
40%
60%
80%
Equities rise nearly
70% between
January 1933
and 1938
Per capita income rises 22%
between 1933 and 1938
WARTIME ECONOMIC CONTROLS
Rationing
Production
Controls
Price/Wage
Controls
Import or
Export
Restrictions
Takeover of
Central Bank
Allies
United States Yes Yes Yes Yes Yes
United Kingdom Yes Yes Yes Yes Partial
Axis
Germany Yes Yes Yes Yes Ye s
Japan Yes Yes Yes Yes Yes
REGULATIONS IMPACTING ASSETS
Market
Closures
Asset
Price
Controls
Asset
Ownership
Restrictions
FX
Controls
Top
Marginal
Tax Rate
Limits on
New
Issuance
Limits
on Corp
Profits
Allies
United States No Yes Yes Yes 94% — Yes
United Kingdom Yes Yes Yes Yes 98% Yes Yes
Axis
Germany Yes Yes Yes Yes 60% Ye s Yes
Japan Yes Yes Yes Yes 74% Yes Yes

27
THE CHANGING WORLD ORDER
0.0
1.0
2.0
3.0
1940 1942 1944 1946 1948 1950
Markets closed
in Germany
and Japan
Equities in
Germany
perform well
as the Axis
powers
dominate from
1939 to 1942
...while the Japanese
war boom fades more
quickly, with strict
government controls
keeping equity prices flat
In contrast, both US and
UK equities rally almost
continuously after the
1942 Battle of Midway
until the end
of the war...
Massive declines
when markets
reopen
EQUITY RETURN INDEX (USD)
USA GBR DEU JPN

28
THE CHANGING WORLD ORDER
Risk Premiums &
Discount Rates
EUR
USA
Individual
Sectors
CHN
JPN
Rising
Growth
Assets
Rising
Inflation
Assets
Falling
Growth
Assets
Falling
Inflation
Assets
USA
Equities
Credit
Spreads
THE BUILDING BLOCKS OF A WELL-DIVERSIFIED PORTFOLIO
CHAPTER 7
INVESTING IN LIGHT OF THE BIG CYCLE
29
THE CHANGING WORLD ORDER
A LOOK AT ASSET RETURNS ACROSS THE GREAT POWERS
(Real Returns, 10-Year Window, Ann)
UNITED STATES GREAT BRITAIN JAPAN GERMANY
Equity Bond Cash Equity Bond Cash Equity Bond Cash Equity Bond Cash
1900–10 9% 0% 1% 3% 2% 2% 4% 1% 4% 3% 2%
1910–20 -2% -4% -3% -6% -7% -5% 1% -5% -4% -14% -10% -14%
1920–30 16% 7% 5% 10% 8% 7% -3% 12% 10% -24% -95% -86%
1930–40 0% 7% 3% 1% 5% 1% 6% 4% -1% 7% 11% 6%
1940–50 3% -2% -5% 3% -1% -4% -28% -34% -33% -4% -16% -19%
1950–60 16% -1% 0% 13% -1% -1% 27% -1% 5% 26% 5% 2%
1960–70 5% -1% 2% 4% 0% 2% 8% 8% 2% 3% 5% 1%
1970–80 -2% -1% -1% -4% -3% -3% 3% -2% -1% -7% 4% 0%
1980–90 13% 9% 4% 16% 8% 5% 19% 9% 4% 10% 6% 3%
1990–00 14% 6% 2% 12% 8% 5% -7% 9% 2% 13% 7% 3%
2000–10 -3% 8% 0% 0% 4% 2% -3% 4% 1% -2% 6% 2%
2010–20 11% 4% -1% 5% 5% -1% 10% 2% 0% 7% 5% -1%
A LOOK AT ASSET RETURNS ACROSS THE GREAT POWERS
(Real Returns, 10-Year Window, Ann)
FRANCE NETHERLANDS ITALY
Equity Bond Cash Equity Bond Cash Equity Bond Cash
1900–10 1% 3% 2% 5% 1% 1% 3% 4%
1910–20 -7% -8% -6% 1% -6% -3% -9% -8% -6%
1920–30 -2% -1% -4% 1% 11% 6% -6% -5% -1%
1930–40 -10% 2% 0% 2% 6% 3% 4% 5% 5%
1940–50 -20% -22% -23% 2% -3% -6% -13% -30% -30%
1950–60 17% 0% -2% 14% 0% -2% 20% 2% 1%
1960–70 0% 2% 1% 2% 0% 0% 0% 2% 0%
1970–80 -2% -3% 0% -3% 2% -2% -13% -8% -1%
1980–90 16% 9% 5% 16% 7% 5% 15% 4% 6%
1990–00 13% 10% 5% 20% 7% 4% 9% 15% 6%
2000–10 -2% 5% 1% -6% 5% 1% -4% 5% 1%
2010–20 7% 6% -1% 8% 5% -1% 3% 8% -1%

30
THE CHANGING WORLD ORDER
RUSSIA CHINA AUSTRIA-HUNGARY
Equity Bond Cash Equity Bond Cash Equity Bond Cash
1900–10 -2% 3% 4% 7% 6% 3% 4% 3% 2%
1910–20 -100% -100% -36% 3% 1% 4% -9% -10% -8%
1920–30 9% 6% 1% -6% -44% -44%
1930–40 2% -7% -6%
1940–50 -100% -100% -73%
1950–60
1960–70
1970–80
1980–90
1990–00
2000–10 15% -2% 4% 1%
2010–20 7% 4% 1% 2% 2% 0%
4
SHARE OF PORTFOLIOS LOSING X% OVER 5 YEARS BY COUNTRY
(60/40 PORTFOLIO, REAL RETURNS)
-50% or worse-90% or worse -25% or worse -10% or worse
0%
20%
40%
60%
80%
100%
1900 1920 1940 1960198020002020
4
For China and Russia, bond data pre-1950 is modeled using hard currency bond returns held as though hedged back to local currency by a domestic
investor; stocks and bonds modeled as full default at time of revolution. Annualized returns assume a full 10-year period even if markets closed during
the decade.

31
THE CHANGING WORLD ORDER
WORST INVESTOR EXPERIENCES (ACROSS MAJOR COUNTRIES)
Major Cases of 60/40 Real Returns Below -40% over a 20-Year Window
Country 20yr Window
Worst 20yr
Return
(Real, Cumul)
Detail
Russia 1900–1918 -100%
The Russian Civil War ended with communist rule,
debt repudiation, and the destruction of financial
markets.
China 1930–1950 -100%
Asset markets closed during WWII and were de
-
stroyed when communist rule took hold in the late
1940s.
Germany 1903–1923 -100%
Weimar Republic hyperinflation led to a collapse in
assets following WWI.
Japan 1928–1948 -96%
Japanese markets and currency collapsed as
markets reopened post-WWII and inflation soared.
Austria 1903–1923 -95%
Similar to Weimar Germany (though less infamous);
hyperinflation led to poor asset returns post-WWI.
France 1930–1950 -93%
The Great Depression, followed by WWII and
German occupation, led to poor returns and high
inflation.
Italy 1928–1948 -87%
Similar to those of other Axis powers, Italian markets
collapsed as WWII concluded.
Italy 1907–1927 -84%
Post-WWI, Italy suffered from economic depression
and high inflation, helping lead to Mussolini’s rise.
France 1906–1926 -75%
The early 20th century saw WWI, followed by France’s
inflationary currency crisis in the early 1920s.
Italy 1960–1980 -72%
Italy endured a series of recessions, high
unemployment rate and inflation, and currency
declines in the 1960–70s.
India 1955–1975 -66%
Post-independence, a series of major droughts
caused weak Indian economic growth and
high inflation.
Spain 1962–1982 -59%
The post-Franco transition to democracy coupled
with the inflationary 1970s strained Spain’s economy.
Germany 1929–1949 -50%
The Great Depression followed by the devastation of
WWII led to a terrible period for German assets.
France 1961–1981 -48%
Like other European nations, the 1960–70s saw weak
-
er growth, currency declines, and high inflation.
UK 1901–1921 -46%
The early 20th century saw World War I, followed by
the depression of 1920–21.
5
5
Cases of poor asset returns in smaller countries such as Belgium, Greece, New Zealand, Norway, Sweden, Switzerland, and across the emerg-
ing world are excluded from this table. Note that for conciseness the worst 20-year window is shown for each country/time period (i.e., including
Germany in 1903–23 precludes including Germany from 1915–35). For our 60/40 portfolios, we assumed monthly rebalancing across the 20-year
window.
32
THE CHANGING WORLD ORDER
PERIODS OF WEALTH CONFISCATION
1900 1920 1940 1960 1980 2000
UK
USA Yes Yes
China Yes Yes
Germany Yes
France
Russia Yes Yes Yes
Austria-Hungary
Italy Yes
Netherlands
Japan Yes
6
PERIODS OF STRICT/RISING CAPITAL CONTROLS
1900 1920 1940 1960 1980 2000
UK Yes Yes Yes Yes
USA Yes Yes
China Yes Yes Yes
Germany Yes Yes Yes Yes
France Yes Yes
Russia Yes Yes Yes Yes Yes Ye s
Austria-Hungary Yes
Italy Yes
Netherlands Yes
Japan Yes Yes
6
While this diagram is not exhaustive, I include instances where I could find clear evidence of each occurring in the 20-year period. For this analysis, wealth
confiscation was defined as extensive seizure of private assets, including large-scale forced, non-economic sales by a government (or revolutionaries in the
case of revolution). Relevant capital controls were defined as meaningful restrictions on investors moving their money to and from other countries and assets
(although this does not include targeted measures directed only at single countries, such as sanctions).
33
THE CHANGING WORLD ORDER
STOCK MARKET CLOSURES ACROSS MAJOR ECONOMIES
Count
Share of Global GDP
10%
20%
30%
40%
50%
0
1
2
3
4
5
6
7
1900 1920 1940 1960 1980 2000 2020
World War I
World War II
9/11
Fall of USSR,
reopening of China's
equity markets
0%
DEATHS IN MAJOR VIOLENT CONFLICTS (%POPULATION)
INTERNAL AND EXTERNAL
1900 1910 1920 1930 1940 1950 1960 1970 1980 1990 2000 2010
UK 0% 2% 0% 0% 1% 0% 0% 0% 0% 0% 0% 0%
USA 0% 0% 0% 0% 0% 0% 0% 0% 0% 0% 0% 0%
China 0% 0% 1% 2% 3% 1% 1% 1% 0% 0% 0% 0%
Germany 0% 3% 0% 9% 15% 0% 0% 0% 0% 0% 0% 0%
France 0% 4% 0% 0% 1% 0% 0% 0% 0% 0% 0% 0%
Russia 0% 4% 5% 10% 13% 0% 0% 0% 0% 0% 0% 0%
Austria-Hungary 0% 2%
Italy 0% 2% 0% 0% 1% 0% 0% 0% 0% 0% 0% 0%
Netherlands 0% 0% 0% 1% 2% 0% 0% 0% 0% 0% 0% 0%
Japan 0% 0% 0% 1% 4% 0% 0% 0% 0% 0% 0% 0%

34
THE CHANGING WORLD ORDER
7
IMPACT OF TAXES ON ROLLING 20-YEAR S&P TOTAL RETURNS
Pre-Tax
Post-Tax
(401[k])
Post-Tax
(Brokerage)
Avg Ann Total Return 9.5% 8.2% 7.9%
Avg Drag from Taxes (Ann Total Return) -1.3% -1.6%
Avg Drag from Taxes (% of Total Returns) -14% -17%
Avg Ann Real Return 6.2% 4.9% 4.6%
Avg Drag from Taxes (Ann Real Return) -1.2% -1.6%
Avg Drag from Taxes (% of Real Returns) -20% -26%
USA FINANCIAL ASSETS SHARE OF TOTAL ASSETS
40%
45%
50%
55%
60%
65%
1900 1920 1940 1960 1980 2000 2020
1929 stock
market bubble
WWII
WWI
FDR
Nifty Fifty
1970s
devaluation
Volcker tightening/
Reagan Revolution
Dot-com
bubble
Housing
bubble
7
Tax impact for 401(k) method applies a 26 percent income tax rate (effective average federal tax rate for top quintile from the Congressional Budget
Office as of 2017) at the conclusion of each 20-year investment period (i.e., tax-free investment growth). Tax impact for brokerage method separately
taxes dividends (at the same 26 percent income tax rate) and capital gains, paying taxes on all capital gains (at a 20 percent rate) from both principal and
dividend reinvestment at the conclusion of each 20-year investment period and netting losses against any gains.
35
THE CHANGING WORLD ORDER
REAL RETURN OF BILLS (VS CPI)
USA GBR DEU FRA ITA JPN CHE ESP NLD
-100%
0%
100%
200%
300%
1900 1920 1940 1960198020002020
GOLD RETURNS DURING 60/40 DRAWDOWNS
Gold Returns (in Global FX) Global 60/40 Drawdowns
-50%
0%
50%
100%
150%
200%
1900 1920 1940 1960198020002020

36
THE CHANGING WORLD ORDER
REAL BOND YIELD
USA EUR JPN
NOMINAL BOND YIELD
-2%
0%
2%
4%
6%
8%
1900 1925 1950 1975 2000 2025
0%
4%
8%
12%
16%
1900 1925 1950 1975 2000 2025
Near
lowest
ever
Near
lowest
ever
REAL CASH RATE
USA EUR JPN
NOMINAL CASH RATE
Near
lowest
ever
Lowest
since
WWII
-8%
-4%
0%
4%
8%
1900 1925 1950 1975 2000 2025
-3%
0%
3%
6%
9%
12%
15%
18%
1900 1925 1950 1975 2000 2025

37
THE CHANGING WORLD ORDER
NOMINAL PAYBACK
PERIOD (YEARS)
CashBonds
REAL PAYBACK
PERIOD (YEARS)
0
20
40
60
80
100
00 20 40 60 80 00 20
0
40
80
120
160
200
00 20 40 60 80 00 20
Will never get your
buying power back

38
THE CHANGING WORLD ORDER
England
Portugal
Habsburg
Spain
France
Genoa
Venice
German
(non-Habsburg)
Holy Roman
Empire
Ottoman Empire
Russia
Poland-Lithuania
Sweden
Habsburg
Central
Europe
Habsburg
Low
Countries
Habsburg
Italy
Papal
States
Ming China
Fragmented
smaller states
CHAPTER 8
THE LAST 500 YEARS
IN A TINY NUTSHELL

39
THE CHANGING WORLD ORDER
BOOK/MANUSCRIPT PRODUCTION IN
MAJOR EUROPEAN COUNTRIES (MLN)
0
100
200
300
400
500
600
1000 1100 1200 1300 1400 1500 1600 1700 1800
Printing press
Hundreds of millions of
texts produced in each of
the subsequent centuries
500600 700800 900
UK CONSUMER
PRICE INDEX
0.0
0.2
0.4
0.6
0.8
1.0
1300 1400 1500 1600 1700
Spanish
Price
Revolution
SILVER PRODUCTION
FROM MEXICO AND
PERU (METRIC TON)
1520 1600 1680 1760
0
2,000
4,000
6,000
8,000
40
THE CHANGING WORLD ORDER
0
2
4
6
8
10
1360 1416 1472 1528 1584 1640 1696 1752 1808 1864
Treasure voyages and
early Ming expansion
Ming-Qing transition
ROUGH COUNT OF TRIBUTARY AREAS
(BASED ON TRIBUTARY VOYAGES OVER 30YR WINDOW)

41
THE CHANGING WORLD ORDER
Level Relative to Own History (1 = Max)
THE NETHERLANDS: INDEX OF KEY DETERMINANTS
0
1
1500 1600 1700 1800 1900 2000
Major Wars Education Innovation and Technology
Competitiveness Military Trade
Economic Output Financial Center Reserve FX Status
CHAPTER 9
THE BIG CYCLE RISE AND
DECLINE OF THE DUTCH
EMPIRE AND THE GUILDER

42
THE CHANGING WORLD ORDER
DUTCH ARC 1550–1850
Major Wars Netherlands Habsburg Spain United Kingdom
Level Relative to Other Empires (1 = Max)
0.2
0.3
0.4
0.5
0.7
0.6
1550 1600 1650 1700175018001850
Thirty
Years’
War
Innovation
Ships & first
global
corporation
Rising
Inequality
New Order
Congress of
Vienna
External Conflict
4th Anglo-
Dutch War
(1)
(2)
(3)
(4)
(5)
(6)
Economic
Problems
Run on Bank
of Amsterdam
Napoleonic
Wars
Global Empire &
Military Strength
New Order
Dutch
independence
Year of
Disaster
(1672)
Economic
Prosperity &
Reserve FX
War of the
Spanish
Succession
Dutch
Rebellion
& Eighty
Years’ War
HABSBURG SPAIN’S ARC IN THE 1500S AND 1600S
Major Wars Spain Netherlands
Level Relative to Other Empires (1 = Max)
0.1
0.2
0.3
0.4
0.5
0.7
0.6
1500 1540 1580162016601700
New
Order
Union
of Spain
& Holy
Roman
Empire
Innovation
Ships &
Age of
Exploration
Global
Empire
Economic Problems
Multiple sovereign defaults
Internal
Conflict
Start of
Dutch
Revolt
Weak
Leadership
Philip II & III
External
Conflict
New Order
Peace of
Westphalia
Habsburgs
inherit
Spain
Conquest
in the
Americas
Spanish
Armada
defeated
Thirty
Years’
War
Catalan &
Portuguese
rebellion
Habsburg
rule over
Spain ends
(1)
(2)
(3)
(4)
(5)
(6)

43
THE CHANGING WORLD ORDER
SHARE OF MAJOR INVENTIONS
(TRAILING 30 YEARS)
0%
4%
8%
12%
16%
1400 1500 1600 1700 1800 1900
EMPIRE SIZE
(% WORLD, EST)
1400 1500 1600 1700 1800 1900 2000
0%
2%
4%
6%
8%
10%
12%
SHARE OF GLOBAL OUTPUT
1400 1500 1600 1700 1800 1900
2%
3%
4%
5%
6%
7%
SPANISH MARAVEDI COIN (GRAMS OF SILVER, INDEXED)
20
40
60
80
100
120
1500 1550 1600 1650170017501800
Spanish coin devalued
massively during the
17th century

44
THE CHANGING WORLD ORDER
NLD UNIVERSITIES FOUNDED
(% WLD)
NLD BOOKS PUBLISHED
(% WLD)
NLD SHARE OF MAJOR
INVENTIONS (OVER 30 YEARS)
NLD EXPORTS
(% WLD)
0%
2%
4%
6%
8%
1500 1600 1700 1800 1900 2000
0%
10%
20%
30%
40%
1500 1600 1700 1800 1900 2000
0%
2%
4%
6%
8%
10%
12%
1500 1600 1700 1800 1900 2000
0%
10%
20%
30%
1500 1600 1700 1800 1900 2000

45
THE CHANGING WORLD ORDER
MAJOR INVENTIONS (PER MLN POPULATION)
NLD GBR FRA
0
1
2
3
4
5
6
7
8
9
1500 1600 170018001900
Unprecedented
innovation
during Dutch
Golden Age
UK innovation rises
with Industrial
Revolution
France lags
REAL GDP PER CAPITA (2017 USD)
EUR NLD GBR ESP DEU FRA
1,000
2,000
4,000
8,000
1400 1500 1600170018001900
Dutch
outperformance
Spanish decline
British
industrialization
German
catch-up

46
THE CHANGING WORLD ORDER
DUTCH EAST INDIA CO
DIVIDENDS (%GDP)
0.0%
0.2%
0.4%
0.6%
0.8%
1625 1675 1725 1775
5
8
10
13
15
18
20
1550 1600 1650170017501800
Limited debasement
after the founding of
the Bank of Amsterdam
GRAMS OF FINE SILVER PER GUILDER

47
THE CHANGING WORLD ORDER
(A) The Dutch declare independence from Spain
(B) Dutch East India Co, Bank of Amsterdam, and stock exchange founded
(C) First and Second Anglo-Dutch Wars
(D) Seven Years’ War and Shadow Banking Crisis of 1763
(E) Fourth Anglo-Dutch War, run on the Bank of Amsterdam
(F) Dutch East India Co nationalized, downfall of the Dutch Empire
0.0
0.1
0.2
0.3
0.4
0.5
0.6
0.7
0.8
1500 1550 1600 1650 1700 175018001850190019502000
DUTCH STANDING RELATIVE TO OTHER GREAT POWERS (EST)
Major Wars Netherlands
(A)
(B)
(C)
(D)
(E)
(F)
Dutch Golden Age
France takes control
of the Netherlands
The Dutch lose
to the British
The Dutch
defeat
the British
Key Events
ACCOUNTS AT BANK
OF AMSTERDAM
BANK OF AMSTERDAM
HOLDINGS (%GDP)
Gold and SilverDeposits
0%
2%
4%
6%
8%
1600 1650 1700 1750 1800
0
1,000
2,000
3,000
1600 1650 1700 1750 1800

48
THE CHANGING WORLD ORDER
-10%
0%
10%
20%
30%
1600 1625 1650 1675 1700 1725 1750 1775
DUTCH EAST INDIA COMPANY BALANCE SHEET (%GDP)
Assets Debt Equity
Dutch East India Company effectively
wiped out in the Fourth Anglo-Dutch War
8
-15
-10
-5
0
5
10
1750 1760 1770 1780 1790 1800
DUTCH EAST INDIA COMPANY PROFIT & LOSS (GUILDER, MLN)
8
is chart only shows the financial results from the Dutch East India Company reported in patria, i.e., the Netherlands. It does not include the parts of
the revenue and debt from its operations in Asia but does include its revenue from goods it sourced in Asia and sold in Europe.

49
THE CHANGING WORLD ORDER
0%
1%
2%
3%
4%
5%
6%
7%
1700 1725 1750 1775 1800
BANK OF AMSTERDAM HOLDINGS (%GDP)
Gold and Silver
As deposit holders exchange their guilder
for gold and silver, the Bank of Amsterdam
loses its holdings in precious metals
0
2
4
6
8
10
12
14
BANK OF AMSTERDAM LOANS OUTSTANDING (GUILDER, MLN)
Govt City Chamber Dutch East India Company
Bank of Amsterdam starts to print
to save Dutch East India Company
1775 1780 1785 1790

50
THE CHANGING WORLD ORDER
0.70
0.80
0.90
1.00
1.10
1775 1780 1785 1790 1795 1800
DUTCH GUILDER
vs Gold vs GBP
(A)
(B)
(C)
(D)
(A) Guilder stable through most of the decline era
(B) Fourth Anglo-Dutch War leads to money printing and initial pressure on
the guilder (run on the Bank of Amsterdam)
(C) Short period of stabilization as investors seek safe havens at the start
of the French Revolution
(D) The French overthrow the Dutch; accounts at the bank basically
wiped out
9
VALUE OF THE
DUTCH GUILDER
0%
20%
40%
60%
80%
100%
1600 1650 1700 1750 1800
BANK OF AMSTERDAM
RESERVE RATIO
(PRECIOUS METAL TO
MONETARY LIABILITIES)
After the Fourth
Anglo-Dutch War, there
is a sharp decline in the
ratio of precious metal to
deposits (as depositors flee)
0.0
0.2
0.4
0.6
0.8
1.0
1.2
1.4
1.6
vs Gold vs Silver vs GBP
Stable during Golden Age
1600 1650 1700 1750 1800
9
To fully represent the likely economics of a deposit holder at the Bank of Amsterdam, we assumed depositors each received their pro-rated share of
precious metal still in the bank’s vaults when it closed (that was roughly 20 percent of the fully backed amount, thus the approximately 80 percent
total devaluation).

51
THE CHANGING WORLD ORDER
10
100
1,000
10,000
1600 1625 1650 1675 1700 1725 1750 1775 1800
DUTCH EIC TOTAL RETURNS BY YEAR OF INITIAL INVESTMENT
(100 = STARTING WEALTH, 50YR INTERVALS, LOG)
1610 1660 1710 1760
Returns go from
incredible to devastating
10
100
1,000
1%
3%
5%
7%
9%
1600 1650 1700 1750 1800
1700 1720 1740 1760 1780 1800
TOTAL EQUITY RETURNS
(INDEXED)
Dutch East India Company
British East India Company
GOVERNMENT BOND YIELDS
GBRNLD

52
THE CHANGING WORLD ORDER
0
1
1600 1650 1700 1750 1800
DUTCH BOND PRICES (TERM ANNUITIES)
Fourth Anglo-
Dutch War
and conquest
by France
Start of various
wars in 1672
Rebound after
the wars end,
but fall with the
Glorious Revolution
Series of
military
losses
against
the French

THE CHANGING WORLD ORDER
53
Relative Power
Time
New
World
Order
New
World
Order
United StatesUnited Kingdom
Netherlands
China
CHANGES TO THE WORLD ORDER (CONCEPTUAL EXAMPLE)
CHAPTER 10
THE BIG CYCLE RISE AND
DECLINE OF THE BRITISH
EMPIRE AND THE POUND

THE CHANGING WORLD ORDER
54
0
1
Level Relative to Own History (1 = Max)
UNITED KINGDOM: INDEX OF KEY DETERMINANTS
1550 1600 1650 1700 1750 1800 1850 1900 1950 2000
Major Wars Education Innovation and Technology
Competitiveness MilitaryTrade
Economic Output Financial Center Reserve FX Status
THE CHANGING WORLD ORDER
55
UK ARC 1600–PRESENT
Major Wars United Kingdom Netherlands United States
Level Relative to Other Empires (1 = Max)
0.1
0.2
0.3
0.4
0.5
0.6
0.7
0.8
New Order
Peace of
Westphalia
Global
Empire &
Reserve FX
Innovation
Industrial
Revolution
External
Conflict & High
Indebtedness
Inequality
& Losing
Innovative
Edge
New Order
US-led
Western
Block
New UK-led Order
Congress of Vienna
English Civil War Victorian EraSuez crisis
WWI &
WWII
1600 1700 1800 1900 20001950185017501650
Napoleonic
wars
(1)
(3)
(4)
(5)
(6)
Internal Conflict &
Emergence of Better
Government
Glorious Revolution
(2)
Innovation
Financial innovations,
competition
with the Dutch
2%
3%
4%
5%
6%
7%
8%
9%
10%
1700 1750 1800 1850
-3%
-2%
-1%
0%
1%
2%
3%
1700 1750 1800 1850
GBR GOVT BOND YIELD
GBR GOVT BOND YIELD
(VS MAJOR
COUNTRY MEDIAN)

THE CHANGING WORLD ORDER
56
GBR GOVT REVENUE (%GDP)
Massive expansion of fiscal state
1500 1550 1600 1650 1700 1750 1800
0%
2%
4%
6%
8%
10%
12%
14%
0
2
4
6
8
1500 1600 1700 1800 1900 1500 1600 1700 1800 1900
NLD GBR FRA
MAJOR INVENTIONS
(PER MLN POPULATION)
SHARE OF
MAJOR INVENTIONS
0%
20%
10%
30%
40%
50%
60%
70%

THE CHANGING WORLD ORDER
57
REAL GDP PER CAPITA (2017 USD)
EUR NLD GBR ESP DEU FRA
1,000
2,000
4,000
8,000
1400 1500 1600170018001900
Dutch
outperformance
Spanish decline
British
industrialization
German
catch-up
FRA GBR
FRENCH UNIVERSITIES
FOUNDED (%WLD, 30YR AVG)
0%
10%
20%
30%
40%
50%
1500 1600 1700 1800 1900 1500 1600 1700 1800 1900
LITERACY RATE (% POP)
10%
20%
30%
40%
50%
70%
90%
60%
80%

THE CHANGING WORLD ORDER
58
FRENCH INFLATION (5-YEAR AVG)
-10%
30%
10%
50%
70%
90%
1700 1720 1740 1760 1780 1800 1820
FRENCH CURRENCY VS GOLD (INDEXED, LOG)
.01%
.1%
10%
1%
100%
1,000%
1750 1770 1790 1810 1830 1850 1870
Currency collapse
accelerates from
1792 to 1796
GBR EMPIRE SIZE (% WORLD, EST)
1600 1650 1700 1750 1800 1850 1900 1950 2000
0%
5%
10%
15%
20%
25%

THE CHANGING WORLD ORDER
59
GBR SHARE OF WORLD EXPORTS (% TOTAL)
0%
30%
20%
40%
50%
10%
1700 1800 1900 2000
Between 1850 and 1914,
about 60% of world trade
denominated in pound sterling
0%
20%
40%
10%
30%
50%
60%
70%
INTERNATIONAL INVESTMENTS (% DEV WLD GDP)
1825 1845 1865 18851835 1855 1875 1895 1905
GBR NLD FRA DEU USA
THE CHANGING WORLD ORDER
60
SHARE OF GLOBAL DEBT
IN GBP (EST)
0%
20%
40%
60%
80%
1700 1800 1900 2000
SHARE OF GLOBAL
TRANSACTIONS IN GBP (EST)
0%
10%
20%
30%
40%
50%
60%
1700 1800 1900 2000
USA GBR DEU
INVENTIONS
(% OF GLOBAL INVENTIONS)
10%
20%
30%
40%
50%
1870 1890 19101870 1890 1910
GDP
(% OF GLOBAL GDP)
10%
20%
30%
UK declines as US and
Germany catch up
Rise of
the US
Steady UK decline
10
10
GBR GDP share includes income of countries controlled by the British Empire.

THE CHANGING WORLD ORDER
61
UK WEALTH GAP (TOP 1% WEALTH SHARE)
55%
65%
60%
70%
75%
1800 1820 1840 1860 1880 1900 1920
0%
1%
2%
3%
1870 1913
PUBLIC EDUCATION EXPENDITURE (%GDP)
GBRDEU FRA
Germany outspends both Britain
and France to develop its
education system
I

THE CHANGING WORLD ORDER
62
% OF NOBEL PRIZES WON
FROM 1900 TO 1913
0%
10%
20%
5%
15%
25%
30%
1870 1880 1890 1900 1910 DEU GBR USA
DEU GBR
SHARE OF WORLD PATENT
APPLICATIONS
0%
5%
15%
25%
10%
20%
German patent applications
become a significant share
of the world’s total and
overtake Britain
GBRDEU FRA
2%
10%
18%
26%
6%
14%
22%
1860 1880 1900
RELATIVE SHARES OF WORLD MANUFACTURING OUTPUT
German manufacturing goes from
less than a half of Britain's in 1860... …to around 75% by 1900
THE CHANGING WORLD ORDER
63
GBR DEU
WARSHIP TONNAGE
(THOUSAND TONS)
0
2,000
1,000
3,000
1870 18901880 1900 19101880 19001890 1910 1914
SHARE OF GLOBAL MILITARY
SPENDING (EST, 10YR AVG)
5%
15%
10%
20%
Competition between
Germany and Britain
leads to a ramp-up
in military armament
by both countries
DEU REAL GDP PER CAPITA
40%
80%
120%
160%
40%
80%
120%
160%
JPN REAL GDP PER CAPITA
35 39 43 4737 41 45 49 35 39 43 4737 41 45 49

THE CHANGING WORLD ORDER
64
JPN SPOT FX VS USD
(INDEXED TO 1935)
35 39 43 4737 41 45 49 35 39 43 4737 41 45 49
DEU Black Market Spot FX vs USD
(Indexed to 1935)
DEU Spot FX vs USD (Indexed to 1935)
0
20
60
100
40
80
0
20
60
100
40
80
June 1948:
FX replaced, with
financial asset
holders facing
-90% haircut
11
GBP SHARE OF
GLOBAL RESERVES
(EX-GOLD, EST)
GBP SHARE
OF GLOBAL
DEBT (EST)
GBP SHARE
OF GLOBAL
TRANSACTIONS
(EST)
0%
20%
40%
60%
80%
100%
1900 1960 2020
WWII
1900 1960 2020
0%
10%
20%
30%
40%
50%
60%
70%
1900 1960 2020
0%
10%
20%
30%
40%
50%
11
is chart shows the official exchange rate between dollars and deutschemarks as well as an unofficial (black market) rate that was based on actual
transactions between New York and Germany during that time period. e unofficial rate shows that the true value of the deutschemark was col-
lapsing during the period.

THE CHANGING WORLD ORDER
65
USD/GBP (INV) GBR FX VS GOLD (£/OZ, INV)
0.15
0.25
0.35
0.45
1900 1935 1970
First devaluation
(1946–49):
Convertibility crisis
when the UK removes
capital controls
Second devaluation
(1967): UK gives
up defending
the peg
19351900 1970
2
4
6
8
10
12
14
16
18
20
USD/GBP (INV) GBR REAL FX VS TWI
-20%
-10%
0%
10%
20%
1930 1940 1950 1960
0.15
0.25
0.35
0.45
1930 1940 1950 1960
GBR CURRENT ACCOUNT (%GDP)
-15%
-10%
-5%
0%
5%
10%
15%
1
9301940195
01
960

THE CHANGING WORLD ORDER
66
GBR CURRENT
ACCOUNT (%GDP)
GBR GOLD
RESERVES (OZ, MLN)
60 62 64 66 68 70
20
30
40
50
60
70
80
90
Gold reserves
fall over the
decade,
accelerating
in 1967
-3%
-2%
-1%
0%
1%
2%
3%
60 62 64 66 68 70
Deterioration of the current
account, connected
to EUR recession
GBR REAL FX VS TWI
-10%
-8%
-6%
-4%
-2%
0%
2%
4%
6%
8%
10%
60 62 64 66 68 70
GBR SHORT RATES
(DIFF TO USA)
60 62 64 66 68 70
-1%
0%
1%
2%
3%
4%
5%
Sharp rate hikes
amid currency
defense
USD/GBP (INV)
60 62 64 66 68 70
0.25
0.30
0.35
0.40
0.45

THE CHANGING WORLD ORDER
67
0%
10%
20%
30%
40%
50%
60%
70%
All Countries
Sterling Agreement Countries
Central banks begin selling their sterling
reserves following the devaluation. The
share of the pound collapses.
Sterling Agreement countries promise to
continue holding pounds, but only if 90
percent of their dollar value is guaranteed
by the British government.
1968 1969 1970 1971 1972
0%
5%
10%
15%
20%
1968 1969 1970 1971 1972
AVERAGE SHARE OF POUNDS IN
CENTRAL BANK RESERVES (%TOTAL)
THE EUROZONE COMPARED TO THE US AND CHINA
EUR USA CHN
Empire Score (0 to 1)* 0.55 0.87 0.75
GDP Per Capita (2017 USD, PPP Adj) 41,50460,23616,411
GDP (%WLD, PPP Adj) 13%17% 23%
Population (%WLD) 4% 4% 18%
Exports (%WLD) 12%11% 15%
Military Spending (%WLD) 9% 28%19%
College Grads (%WLD) 13%20% 22%
Patents (%WLD) 11%17% 41%
Nobel Prizes (%WLD) 11%32% 2%
Equity Mkt Cap (%WLD) 8% 55%10%
28%55% 2%
21%62% 2%
*Europe Empire Arc treats major Eurozone countries as single unit for purposes
of comparison.
Intl Transactions in Currency (%WLD)
Official Reserves Held in Currency (%WLD)

THE CHANGING WORLD ORDER
68
DEU FRA ITA ESP GRC
GDP PER CAPITA
(2010 USD)
GDP PER CAPITA
(2010 USD, INDEXED TO 2007)
00 05 10 15 20
20,000
30,000
40,000
50,000
70%
90%
110%
130%
00 05 10 15 20

69
THE CHANGING WORLD ORDER
Level Relative to Own History (1 = Max)
UNITED STATES: INDEX OF KEY DETERMINANTS
0
1
1700 1800 1900 2000
Major Wars Education Innovation and Technology
Competitiveness Military Trade
Economic Output Financial Center Reserve FX Status
CHAPTER 11
THE BIG CYCLE RISE AND
DECLINE OF THE UNITED
STATES AND THE DOLLAR

70
THE CHANGING WORLD ORDER
US ARC 1750–PRESENT
Major Wars United States United Kingdom China
Level Relative to Other Empires (1 = Max)
0.0
0.2
0.4
0.6
0.8
1.0
New Order
Strong Leadership
Founding Fathers
Internal
Conflict
Innovation
2nd Industrial
Revolution
Military Strength
Global Empire
& Reserve FX
New Order
US-led
Western Bloc
WWII
American
Revolution Cold WarWWI
Louisiana
Purchase
Gilded Age &
Progressive Era
1750 1800 1850 1900 1950 2000
Mexican-
American
War
Civil
War
Innovation
Digital
Revolution
(1)
(2)
(3)
(4)
(5)
Rising
Inequality
& High
Indebtedness
80
100
90
110
1912 1915 1918 19191911 1914 19171910 1913 1916
SPOT FX RATE VS USD (INDEXED)
Devaluation against the
dollar during World War I
GBR FRA DEU

71
THE CHANGING WORLD ORDER
0
1
1940 1960 1980 2000 2020
Level Relative to Other Empires (1 = All-Time Max)
RELATIVE STANDING OF GREAT EMPIRES
USA GBRCHN RUS
1945 1965 1985 2005
NUCLEAR WEAPONS STOCKPILE (# WARHEADS, LOG)
USA CHNGBR IND RUS FRA
1
10
100
1,000
10,000
100,000
72
THE CHANGING WORLD ORDER
45 55 65 75 85 95 05 15 45 55 65 75 85 95 05 15
USA Long Rates
USA Short Rates
USA Core Inflation
USA Headline Inflation
0%
4%
8%
12%
16%
20%
0%
4%
8%
12%
16%
20%
1990 2000 20102020
EXPORTS OF GOODS AND SERVICES MINUS IMPORTS
OF GOODS AND SERVICES (REAL, USD BLN, 12MMA)
USA CHN
-1,200
1,200
-600
0
600
Country gets richer
Country gets poorer

73
THE CHANGING WORLD ORDER
20%
60%
100%
140%
180%
1900 1920 1940 1960 1980 2000 2020
When the cycle
changes
New
World Order
When the cycle
changes
PRIVATE SECTOR NON-FIN DEBT (%GDP, 6MMA)
4%
9%
14%
19%
24%
29%
0%
4%
8%
12%
16%
20%
1900 1920 1940 1960 1980 2000 2020
When the cycle
changes
New
World Order
When the
cycle
changes
USA Interest Rates
USA Monetary Base (%GDP)
74
THE CHANGING WORLD ORDER
USA INCOME SHARES
Top 10% Bottom 90%
20%
30%
40%
50%
60%
70%
80%
1920 1970 2020
USA WEALTH SHARES
Top 0.1% Bottom 90%
0%
10%
20%
30%
40%
50%
1920 1970 2020
House Democrat
Senate Democrat
House Republican Senate Republican
IDEOLOGICAL POSITIONS OF THE MAJOR PARTIES
-40%
-30%
-20%
-10%
0%
0%
10%
20%
30%
40%
50%
60%
1900 1920 1940 1960 1980 2000 2020
More
conservative
Less
conservative
Greatest
gap

75
THE CHANGING WORLD ORDER
SHARE OF CONGRESSIONAL MEMBERS’ VOTES
CAST ALONG PARTY LINES
1790 1830 1870 1910 1950 1990 2030
60%
70%
80%
90%
100%
This chart shows the average predictiveness of a given member’s left/right
ideology in determining their vote across chambers for each congressional session
as measured by NOMINATE, an academic model of ideological preference.
0%
10%
20%
30%
40%
50%
60%
70%
USA Unemployment Rate USA CB Balance Sheet (%GDP)
UNITED STATES
00 20 40 60 80 00 2000 20 40 60
0%
10%
20%
30%
80 00 20
EUR Unemployment Rate EUR CB Balance Sheet (%GDP)
EUROPE
GBR Unemployment Rate GBR CB Balance Sheet (%GDP)
UNITED KINGDOM
JPN Unemployment Rate JPN CB Balance Sheet (%GDP)
JAPAN
00 20 40 60 80 00 20
0%
2%
4%
6%
8%
10%
12%
14%
00 20 40 60 80 00 20
0%
5%
10%
15%
20%
25%
00 20 40 60 80 00 20
0%
10%
20%
30%
40%
50%
00 20 40 60 80 00 20
0%
2%
4%
6%
8%
00 20 40 60 80 00 20
0%
40%
80%
120%
0%
10%
20%
30%
40%
00 20 40 60 80 00 20

76
THE CHANGING WORLD ORDER
0%
10%
20%
30%
40%
50%
60%
70%
USA Unemployment Rate USA CB Balance Sheet (%GDP)
UNITED STATES
00 20 40 60 80 00 2000 20 40 60
0%
10%
20%
30%
80 00 20
EUR Unemployment Rate EUR CB Balance Sheet (%GDP)
EUROPE
GBR Unemployment Rate GBR CB Balance Sheet (%GDP)
UNITED KINGDOM
JPN Unemployment Rate JPN CB Balance Sheet (%GDP)
JAPAN
00 20 40 60 80 00 20
0%
2%
4%
6%
8%
10%
12%
14%
00 20 40 60 80 00 20
0%
5%
10%
15%
20%
25%
00 20 40 60 80 00 20
0%
10%
20%
30%
40%
50%
00 20 40 60 80 00 20
0%
2%
4%
6%
8%
00 20 40 60 80 00 20
0%
40%
80%
120%
0%
10%
20%
30%
40%
00 20 40 60 80 00 20

77
THE CHANGING WORLD ORDER
0%
10%
20%
30%
40%
50%
60%
70%
USA Unemployment Rate USA CB Balance Sheet (%GDP)
UNITED STATES
00 20 40 60 80 00 2000 20 40 60
0%
10%
20%
30%
80 00 20
EUR Unemployment Rate EUR CB Balance Sheet (%GDP)
EUROPE
GBR Unemployment Rate GBR CB Balance Sheet (%GDP)
UNITED KINGDOM
JPN Unemployment Rate JPN CB Balance Sheet (%GDP)
JAPAN
00 20 40 60 80 00 20
0%
2%
4%
6%
8%
10%
12%
14%
00 20 40 60 80 00 20
0%
5%
10%
15%
20%
25%
00 20 40 60 80 00 20
0%
10%
20%
30%
40%
50%
00 20 40 60 80 00 20
0%
2%
4%
6%
8%
00 20 40 60 80 00 20
0%
40%
80%
120%
0%
10%
20%
30%
40%
00 20 40 60 80 00 20
POLITICAL SPECTRUM 50 YEARS AGO
POLITICAL SPECTRUM 2021
12
12
Shading indicates degree of polarization.

78
THE CHANGING WORLD ORDER
0
1
1500 1600 1700 1800 1900 2000
Level Relative to Other Empires (1 = All-Time Max)
RELATIVE STANDING OF GREAT EMPIRES
FranceGermanySpainNetherlands
Ottoman EmpireJapanIndia
United KingdomChinaUnited StatesMajor Wars
Russia
CHAPTER 12
THE BIG CYCLE RISE OF
CHINA AND THE RENMINBI

79
THE CHANGING WORLD ORDER
Level Relative to Own History (1 = Max)
CHINA: INDEX OF KEY DETERMINANTS
0
1
1800 1850 190019502000
Major Wars Education Innovation and Technology
Competitiveness Military Trade
Economic Output Financial Center Reserve FX Status
Major Wars Rough Estimate of China’s Relative Standing vs Great Powers
0
1
600 800 1000 1200 1400 1600 1800 2000
Tang
Dynasty
Level Relative to Other Empires
(1 = All-Time Max)
Song
Dynasty
Yuan
Dynasty
Ming
Dynasty
Qing
Dynasty
RC PRC

80
THE CHANGING WORLD ORDER
TRANSITIONS ACROSS DIFFERENT TYPES
OF MONEY IN CHINESE HISTORY
Type 1
Type 2
Type 3
Tang
618–
907
Northern
Song
960–
1127
Southern
Song
1127–
1279
Early-
Mid
Qing
1644–
1800
People’s
Rep of
China
1949–
Pres
Yuan
1279–
1368
Ming
1368–
1644
Late
Qing
~1800–
1911
Rep of
China
1911–
1949
13
Inflation pre-1926 quoted in
silver terms, post-1926 in RMB
CHINESE INFLATION (Y/Y)
-10%
0%
10%
20%
30%
1750 1775 1800 1825 1850 1875 190019251950197520002025
Hyperinflation
13
I produced this diagram working with Professor Jiaming Zhu.

81
THE CHANGING WORLD ORDER
CNY VS USD (INV)
GOLD PRICE (IN CNY, INV)
0
2
4
6
8
10
1920 1970 2020
Up = stronger
RMB
1920 1970 2020
0
4,000
8,000
12,000
16,000
Up = stronger
RMB
CHN INFLATION (Y/Y)
CHN REAL GROWTH (Y/Y)
-30%
-20%
-10%
0%
10%
20%
30%
40%
50%
1920 1970 2020
-30%
-20%
-10%
0%
10%
20%
30%
1920 20201970

82
THE CHANGING WORLD ORDER
CHINA'S DEVELOPMENT SINCE 1949 AND 1978
1949 1978 2018 ∆ Since 1949 ∆ Since 1978
RGDP Per Capita* 348 609 15,24344x 25x
Share of World GDP 2% 2% 22%12x 11x
Population Below the
Poverty Line ($1.90/Day)**
— 96% 1% at least -96% -96%
Life Expectancy 41 66 77 +36 Yrs+11 Yrs
Infant Mortality Rate
(per 1,000 Births)
200 53 7-96%-86%
Urbanization 18% 18% 59%+41%+41%
Literacy 47% 66% 97%+50%+31%
Avg Yrs of Education 1.7 4.4 7.9
+6.2 Yrs+3.5 Yrs
*USD 2017, PPP-adjusted
**The World Bank only has poverty data back to 1981

83
THE CHANGING WORLD ORDER
UNITED STATES CHINA
1980 Today Change
Change
(%)
1980 TodayChange
Change
(%)
Average Years
of Schooling
11.9 13.6 +1.7 +14% 4.67.9 +3.3 +72%
Govt Spending
on Education
(% of GDP)
5.30% 5.50% 0.20% +4%1.90% 5.20% 3.30% +174%
Est Population w/
Tertiary Education
(Mln)
25 60 +35+140% 3120 +117 +3,900%
Population w/
Tertiary Education
(% Working-Age Pop)
17% 28% 11% +68% 1% 12%11% +2,272%
Population w/
Tertiary Education
(% World)
35% 15% -20% -57% 4% 31%+27%+590%
STEM Majors (Mln) 38+5 +141% 121+21 +4,120%
STEM Majors (% World) 29% 11% -18% -62% 5% 31%+26%+535%

84
THE CHANGING WORLD ORDER
SHARE OF CENTRAL BANK
RESERVES BY CURRENCY
USD 51%
EUR 20%
Gold 12%
JPY 6%
GBP 5%
CNY 2%
Based on data through 2019
CHAPTER 13
US-CHINA RELATIONS
AND WARS

85
THE CHANGING WORLD ORDER
GLOBAL POPULATION (MLN)
0
2,000
4,000
6,000
8,000
0
2,000
4,000
6,000
8,000
1500 1600 18001700 1900 2000 1900 1940 19801920 1960 2000 2020
GLOBAL POPULATION GROWTH (10YR CHG, EST)
-5%
0%
5%
10%
15%
20%
25%
0%
5%
10%
15%
20%
25%
1500 1600 18001700 1900 2000 1900 1940 19801920 1960 2000 2020
Baby Boom
WWIIWWI
Thirty
Years’
War
Collapse
of Ming
Dynasty
Industrial
Revolution
Baby Boom
WWII
WWI
CHAPTER 14
THE FUTURE

86
THE CHANGING WORLD ORDER
14
10
20
40
60
80
30
50
70
10
20
40
60
80
30
50
70
1500 1600 18001700 1900 2000
GLOBAL LIFE EXPECTANCY AT BIRTH
1900 19751925 1950 2000 2025
COVID-19
WWII
Baby
Boom
WWI,
Spanish flu
pandemic
Thirty
Years’
War
Baby
Boom
WWII
WWI,
Spanish flu
pandemic
HIV/AIDS
epidemic
COVID-19
Flu
outbreak
& famine
1557 influenza
pandemic
Third Plague
pandemic
GLOBAL RGDP
PER CAPITA (LOG)
8
7
9
10
11
0
30,000
40,000
10,000
20,000
1500 1600 18001700 1900 2000
GLOBAL RGDP
PER CAPITA (2017 USD)
1900 19801940 2020
Inflection during the
Industrial Revolution
Invention of
capitalism
(founding of
Amsterdam
Stock
Exchange)
14
Importantly, a number of the charts shown on these pages rely on the record from fewer countries further in the past, due to limited reliable data
history. Life expectancy prior to the 1800s is solely based on Great Britain (marked by the dotted line). Global RGDP is primarily a mix of European
countries before 1870. And there are not good records of total wealth prior to the 1900s, so I can’t show you the picture before then.

87
THE CHANGING WORLD ORDER
GLOBAL REAL WEALTH PER CAPITA
(ROUGH ESTIMATE, 2017 USD, LOG)
1900 1920 1940 1960 1980 2000 2020
1,000
10,000
100,000
Collapse of Qing,
WWI, Russian
Revolution, and
Spanish flu
Roaring
’20s
Great
Depression
WWII
PRC
founded
Peak of American
Empire
Great Leap
Forward,
famines
Deng
Xiaoping
reforms
Digital
Revolution
Dot-com
bubble
2008 financial
crisis
COVID-19
GLOBAL RGDP PER CAPITA DRAWDOWNS
-25%
10%
-20%
-10%
-5%
0%
1500 1600 1700 1800 20001900 1900 1920 1960 20001940 1980 2020
-16%
-12%
-8%
-4%
0%
2008
crisis
COVID-19
WWI
WWII
Great
Depression
Panic
of 1819
Anglo-French
War
Dutch Revolt
against Spain
WWI
WWII
COVID-19
2008
financial
crisis
Great
Depression
GLOBAL REAL WEALTH PER CAPITA DRAWDOWNS
-40%
-30%
-20%
-10%
0%
1900 1920 1940 1960 1980 2000 2020
Great
Depression
1970s
stagflation
Collapse of Qing,
WWI, Russian Revolution,
and Spanish flu
WWII
2008 financial
crisis

88
THE CHANGING WORLD ORDER
GLOBAL DEATHS BY CATEGORY
(RATE PER 100K PEOPLE, 15YMA)
FaminesNatural Disasters Pandemics
0
50
100
150
200
250
300
Indian
famine
Spanish flu
HIV/
AIDS
Indian and
Chinese
famines
China’s
Great Leap
Forward
Series of
Indian
famines
Cocoliztli
epidemics
Russian
famine
French
famine
COVID-19
1500 1600 1700 1800 1900 2000

89
THE CHANGING WORLD ORDER
ESTIMATED DEATHS FROM CONFLICT
(MAJOR POWERS, %POP, 15YMA)
Internal Conflict External Conflict Total
1400 1500 1600 1700 1800 1900 2000
0.0%
0.1%
0.2%
0.3%
0.4%
0.5%
Wars of
Religion in
France
European
monarchic
wars
Chinese
border
wars,
religious
wars in
Europe
Collapse of Ming Dynasty,
religious wars in Europe
WWII, Holocaust,
communist
revolutions
Time of
Troubles in
Russia
Seven
Years’ War
in Europe
Napoleonic
Wars
Ethnic wars
in China
WWI
CURRENT INNOVATION AND TECHNOLOGY SCORE
-1.5
1.0
0.0
2.0
0.5
-0.5
1.5
2.5
-1.0
USA JPN GBRCHN DEUEUR NLD ESPRUSFRA IND
15
15
Arrows denote the 20-year change in the gauge.

90
THE CHANGING WORLD ORDER
USA FRA INDESP JPNGBR EUR RUSNLDCHN DEU
-2
-1
0
1
2
DEBT BURDEN (UP = WORSE FINANCIAL POSITION)
USA GBREUR CHNJPN RUS IND
0%
20%
40%
60%
10%
30%
50%
RESERVE CURRENCY STATUS
16
16
Individual European countries are not shown on the reserve currency status gauge due to the European Monetary Union (all these countries use
the euro)—so only the Europe aggregate is shown. e measure shows an average of what share of global transactions, debts, and official central bank
reserve holdings are denominated in each country’s currency.

91
THE CHANGING WORLD ORDER
NLD FRAJPN USACHN ESPGBRDEU RUS
-1.5
0.0
1.5
2.5
-1.0
1.0
-0.5
0.5
2.0
RELATIVE INTERNAL CONFLICT GAUGE Z-SCORE FOR
MAJOR POWERS TODAY (UP = MORE CONFLICT)
1780 1900181020201870 196019301840 1990
1
3
-1
0
2
USA INTERNAL CONFLICT GAUGE Z-SCORE
(UP = MORE CONFLICT)

92
THE CHANGING WORLD ORDER
Political Conflict
-3
0
3
-2
2
-1
1
4
5
1780 1840 1900 1960 2020 1780 1840 1900 1960 2020
Internal Strife
-3
-2
1
3
0
-1
2
USA INTERNAL CONFLICT GAUGE BREAKDOWN
USA
JPN
USA
DEU
GBR
DEU
USA
CHN
USA
GBR
CHN
GBR
CHN
JPN
GBR
JPN
USA
RUS
0.0
-0.8
0.4
-0.4
0.8
LATEST INTERCOUNTRY CONFLICT Z-SCORE
(UP = MORE CONFLICT)
93
THE CHANGING WORLD ORDER
1970 20101980 202020001990
0.0
-0.8
0.4
-0.4
0.8
USA-CHINA CONFLICT GAUGE Z-SCORE
USA EUR FRACHN INDRUS JPN ESPDEUGBR NLD
-1
0
-2
1
2
CURRENT MILITARY STRENGTH (UP = STRONGER)

94
THE CHANGING WORLD ORDER
Indian
famine
Spanish flu
Indian and
Chinese
famines
China’s
Great Leap
Forward
Series of
Indian
famines
Cocoliztli
epidemics
Russian
famine
French
famine
HIV/
AIDS
COVID-19
GLOBAL DEATHS BY CATEGORY
(RATE PER 100K PEOPLE)
FaminesNatural Disasters Pandemics
1500 1600 1700 1800 1900 2000
0
200
400
600
800
1,000
1,200
1,400
0100050015002000 1900 1940 1980 2020
GLOBAL TEMPERATURE
VS 1961–1990 AVG
(ºC, SINCE 0 CE)
Carbon Dioxide Concentration (PPM)
Global Land and Ocean Temperature
Anomalies (ºC)
270
350
430
310
390
1.2
0.0
-0.4
0.8
0.4
Medieval
Warm
Period
Little Ice
Age
-1.0
0.0
1.0
-0.5
0.5

95
THE CHANGING WORLD ORDER
1970 20101980 202020001990
0
150
250
50
100
200
NUMBER OF NATURAL CATASTROPHIC EVENTS
1970 20101980 202020001990
0
150
350
50
100
250
300
200
TOTAL LOSSES FROM CATASTROPHES SINCE 1970
(2020 USD, BLN)
Hurricane
Katrina
Japan, NZ
earthquake
Hurricanes
Harvey,
Irma,
Maria
Annual 5yr Average

96
THE CHANGING WORLD ORDER
NLD
FRA
TUR
CAN
EUR
USA
RUS
SAR
CHN
SGP
PHP
GBR
JPN
ITA
DEU
AUS
KOR
ESP
SAF
BRZ
MEX
MAL
IDR
IND
TLD
-1.5
-0.5
0.5
1.5
2.5
-1.0
0.0
1.0
2.0
CLIMATE CHANGE VULNERABILITY (UP = MORE VULNERABLE)

97
THE CHANGING WORLD ORDER
CURRENT READINGS ACROSS MAJOR POWERS
(Z-Score and 20-Year Change Denoted by Arrows)
GAUGE
QUALITY
USA CHN EUR DEU
EMPIRE SCORE (0–1) 0.87
0.75 0.55 0.37
Debt Burden
(Big Economic Cycle)
Good -1.8 0.3 -0.3 1.6
Expected Growth
(Big Economic Cycle)
Good -0.7
0.4 -1.0 -1.0
Internal Conflict
(Internal Order; low is bad)
Good -2.0
0.2 0.4 0.7
Education Good 2.0 1.6 0.3 -0.2
Innovation & Technology Good 2.0 1.5 0.4 -0.1
Cost Competitiveness Good -0.4 1.2 -0.6 -0.6
Military Strength Good 1.9 1.0 0.3 -0.6
Trade Good 1.1 1.8 1.3 0.6
Economic Output Good 1.7 1.8 0.6 -0.1
Markets & Financial Center Good 2.6 0.5 0.4 -0.2
Reserve Currency Status (0–1) Good 0.55 0.04 0.23
Geology Good 1.4 0.9 -0.4 -0.7
Resource-Allocation Efficiency OK 1.3 0.0 -0.8 0.6
Acts of Nature OK -0.2 -0.1 0.0 1.1
Infrastructure & Investment Good 0.7
2.7 0.2 -0.3
Character/Civility/Determination OK 1.1 1.5 -1.0 -0.5
Governance/Rule of Law Good 0.7 -0.7 -0.4 0.7
Gaps in Wealth, Opportunity
& Values
OK -1.6 -0.4 0.3 0.7

98
THE CHANGING WORLD ORDER
GAUGE
QUALITY
JPN IND GBR FRA
EMPIRE SCORE (0–1) 0.30
0.27 0.27 0.25
Debt Burden
(Big Economic Cycle)
Good -0.4 0.1 -1.6 -0.8
Expected Growth
(Big Economic Cycle)
Good -1.1 1.1 -0.8 -0.9
Internal Conflict
(Internal Order; low is bad)
Good 1.1 -0.3 -0.1
Education Good 0.2 -1.2 -0.2 -0.5
Innovation & Technology Good 0.2 -1.2 -0.3 -0.5
Cost Competitiveness Good -0.3 2.4 -0.3 -0.6
Military Strength Good -0.1 0.2 -0.3 -0.3
Trade Good -0.5 -0.8 -0.6 -0.5
Economic Output Good -0.3 -0.2 -0.3 -0.5
Markets & Financial Center Good 0.1 -0.8 0.0 -0.3
Reserve Currency Status (0–1) Good 0.07 0.0 0.07
Geology Good -1.1 0.3 -0.9 -0.5
Resource-Allocation Efficiency OK 0.1 0.2 0.3 -1.3
Acts of Nature OK 1.5 -2.4 0.4 0.0
Infrastructure & Investment Good -0.2
-0.3 -0.6 -0.2
Character/Civility/Determination OK 0.5 1.3 -0.4 -1.5
Governance/Rule of Law Good 0.8 -1.1 1.2 0.3
Gaps in Wealth, Opportunity
& Values
OK 0.9 -1.8 -0.2 1.1

99
THE CHANGING WORLD ORDER
GAUGE
QUALITY
NLD RUS ESP
EMPIRE SCORE (0–1) 0.25
0.23 0.20
Debt Burden
(Big Economic Cycle)
Good 0.8 1.0 -1.7
Expected Growth
(Big Economic Cycle)
Good -0.8 -0.2 -1.1
Internal Conflict
(Internal Order; low is bad)
Good 1.2 -0.5 -0.4
Education Good -0.7 -0.5 -0.9
Innovation & Technology Good -0.3 -0.7 -1.0
Cost Competitiveness Good -0.8 0.7 -0.6
Military Strength Good -1.9 0.4 -0.8
Trade Good -0.6 -0.9 -0.9
Economic Output Good -0.3 -1.4 -0.9
Markets & Financial Center Good -0.5 -1.1 -0.6
Reserve Currency Status (0–1) Good 0.0
Geology Good -0.5
1.9 -0.6
Resource-Allocation Efficiency OK -0.1 1.3 -1.6
Acts of Nature OK 0.5 -0.1 -0.7
Infrastructure & Investment Good -0.4
-1.0 -0.6
Character/Civility/Determination OK -0.3 0.1 -1.0
Governance/Rule of Law Good 1.0 -1.9 -0.7
Gaps in Wealth, Opportunity
& Values
OK 0.6 0.4
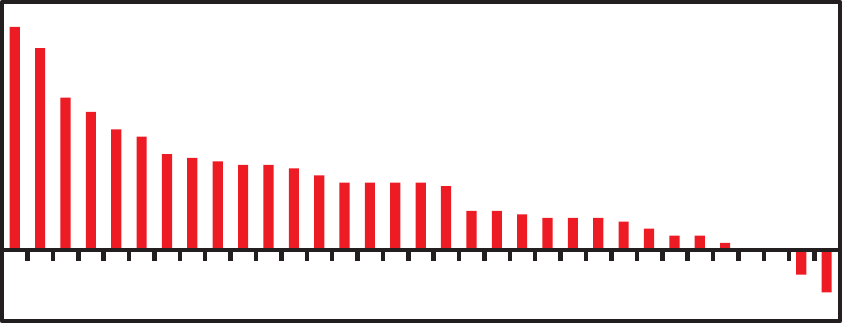
100
THE CHANGING WORLD ORDER
-2%
0%
3%
5%
7%
-1%
2%
1%
4%
6%
REAL GDP GROWTH ESTIMATE (NEXT 10 YEARS, ANN)
IND
IDR
CHN
TUR
MEX
SAF
COL
PLD
RUS
TLD
SWE
CHI
HUN
KOR
SGP
BRZ
AUS
CZK
CHE
USA
CAN
NLD
BEL
GBR
ARG
PRT
FRA
NOR
DEU
JPN
ESP
ITA
GRC

101
THE CHANGING WORLD ORDER
APPENDIX
COMPUTER ANALYSIS OF THE
CONDITIONS OF, AND PROSPECTS FOR,
THE WORLD’S LEADING COUNTRIES
UNITED STATES—KEY DRIVERS OF OUR COUNTRY POWER SCORE
Overall Empire Score (0–1) Level: 0.87 Rank: 1
The Big Cycles Level Z-Score Rank Trajectory
Economic/Financial Position Unfavorable -1.7 10
Debt Burden High Debt -1.8 11
Expected Growth 1.1% -0.7 4
Internal Order High Risk -1.8 11
Wealth/Opportunity/Values Gap Large -1.6 9
Internal Conflict Very High -2.0 10
External Order At Risk
Eight Key Measures of Power
Markets & Financial Center Very Strong 2.6 1
Innovation & Technology Very Strong 2.0 1
Education Very Strong 2.0 1
Military Strength Very Strong 1.9 1
Reserve Currency Status Very Strong 1.7 1
Economic Output Very Strong 1.7 2
Trade Strong 1.1 3
Cost Competitiveness Average -0.4 6
Additional Measures of Power
Geology Strong 1.4 2
Resource-Allocation Efficiency Strong 1.3 2
Infrastructure & Investment Strong 0.7 2
Character/Determination/Civility Strong 1.1 3
Governance/Rule of Law Strong 0.7 5
Acts of Nature Average -0.2 9
Getting better Getting worse Flat

102
THE CHANGING WORLD ORDER
CHINA—KEY DRIVERS OF OUR COUNTRY POWER SCORE
Overall Empire Score (0–1) Level: 0.75 Rank: 2
The Big Cycles Level Z-Score Rank Trajectory
Economic/Financial Position
Somewhat
Favorable
0.4 3
Debt Burden Low Debt 0.3 4
Expected Growth 4.3% 0.4 2
Internal Order Moderate Risk -0.1 7
Wealth/Opportunity/Values Gap Relatively Large -0.4 8
Internal Conflict Average 0.2 5
External Order At Risk
Eight Key Measures of Power
Trade Very Strong 1.8 1
Economic Output Very Strong 1.8 1
Education Strong 1.6 2
Innovation & Technology Strong 1.5 2
Cost Competitiveness Strong 1.2 2
Military Strength Strong 1.0 2
Markets & Financial Center Average 0.4 2
Reserve Currency Status Weak -0.7 5
Additional Measures of Power
Infrastructure & Investment Very Strong 2.7 1
Character/Determination/Civility Strong 1.5 1
Geology Strong 0.9 3
Resource-Allocation Efficiency Average 0.0 7
Governance/Rule of Law Weak -0.7 8
Acts of Nature Average -0.1 8
Getting better Getting worse Flat

103
THE CHANGING WORLD ORDER
EUROZONE—KEY DRIVERS OF OUR COUNTRY POWER SCORE
Overall Empire Score (0–1) Level: 0.55 Rank: 3
The Big Cycles Level Z-Score Rank Trajectory
Economic/Financial Position
Moderately
Unfavorable
-0.9 6
Debt Burden
Moderately
High Debt
-0.3 6
Expected Growth 0.3% -1.0 8
Internal Order Low Risk 0.3 5
Wealth/Opportunity/Values Gap Typical 0.3 6
Internal Conflict Average 0.4 4
External Order
Eight Key Measures of Power
Trade Strong 1.3 2
Reserve Currency Status Average 0.1 2
Economic Output Strong 0.6 3
Markets & Financial Center Average 0.4 3
Innovation & Technology Average 0.4 3
Education Average 0.3 3
Military Strength Average 0.3 4
Cost Competitiveness Weak -0.6 8
Additional Measures of Power
Infrastructure & Investment Average 0.2 3
Geology Average -0.4 5
Governance/Rule of Law Average -0.4 7
Resource-Allocation Efficiency Weak -0.8 9
Character/Determination/Civility Weak -1.0 10
Acts of Nature Average 0.0 5
Getting better Getting worse Flat
104
THE CHANGING WORLD ORDER
GERMANY—KEY DRIVERS OF OUR COUNTRY POWER SCORE
Overall Empire Score (0–1) Level: 0.37 Rank: 4
The Big Cycles Level Z-Score Rank Trajectory
Economic/Financial Position
Somewhat
Favorable
0.4 4
Debt Burden Low Debt 1.6 1
Expected Growth 0.3% -1.0 9
Internal Order Low Risk 0.7 3
Wealth/Opportunity/Values Gap Narrow 0.7 3
Internal Conflict Low 0.7 3
External Order
Eight Key Measures of Power
Trade Strong 0.6 4
Economic Output Average -0.1 4
Innovation & Technology Average -0.1 5
Education Average -0.2 5
Markets & Financial Center Average -0.2 6
Military Strength Weak -0.6 9
Cost Competitiveness Weak -0.6 10
Reserve Currency Status
Additional Measures of Power
Resource-Allocation Efficiency Strong 0.6 3
Governance/Rule of Law Strong 0.7 4
Infrastructure & Investment Average -0.3 7
Character/Determination/Civility Average -0.5 8
Geology Weak -0.7 9
Acts of Nature Strong 1.1 2
Getting better Getting worse Flat

105
THE CHANGING WORLD ORDER
JAPAN—KEY DRIVERS OF OUR COUNTRY POWER SCORE
Overall Empire Score (0–1) Level: 0.30 Rank: 5
The Big Cycles Level Z-Score Rank Trajectory
Economic/Financial Position Unfavorable -1.1 7
Debt Burden
Moderately
High Debt
-0.4 7
Expected Growth 0.0% -1.1 11
Internal Order Low Risk 1.0 1
Wealth/Opportunity/Values Gap Narrow 0.9 2
Internal Conflict Low 1.1 2
External Order
Eight Key Measures of Power
Reserve Currency Status Weak -0.5 3
Education Average 0.2 4
Innovation & Technology Average 0.2 4
Markets & Financial Center Average 0.1 4
Cost Competitiveness Average -0.3 4
Trade Average -0.5 5
Military Strength Average -0.1 6
Economic Output Average -0.3 7
Additional Measures of Power
Governance/Rule of Law Strong 0.8 3
Character/Determination/Civility Average 0.5 4
Infrastructure & Investment Average -0.2 4
Resource-Allocation Efficiency Average 0.1 6
Geology Weak -1.1 11
Acts of Nature Strong 1.5 1
Getting better Getting worse Flat

106
THE CHANGING WORLD ORDER
INDIA—KEY DRIVERS OF OUR COUNTRY POWER SCORE
Overall Empire Score (0–1) Level: 0.27 Rank: 6
The Big Cycles
Level Z-Score Rank Trajectory
Economic/Financial Position
Highly
Favorable
0.8 1
Debt Burden
Moderately Low
Debt
0.1 5
Expected Growth 6.3% 1.1 1
Internal Order High Risk -1.8 10
Wealth/Opportunity/Values Gap Large -1.8 10
Internal Conflict Very Low
External Order
Eight Key Measures of Power
Cost Competitiveness Very Strong 2.4 1
Military Strength Average 0.2 5
Economic Output Average -0.2 5
Reserve Currency Status Weak -0.8 6
Trade Weak -0.8 9
Markets & Financial Center Weak -0.8 10
Innovation & Technology Weak -1.2 11
Education Weak -1.2 11
Additional Measures of Power
Character/Determination/Civility Strong 1.3 2
Geology Average 0.3 4
Resource-Allocation Efficiency Average 0.2 5
Infrastructure & Investment Average -0.3 6
Governance/Rule of Law Weak -1.1 10
Acts of Nature Very Weak -2.4 11
Getting better Getting worse Flat

107
THE CHANGING WORLD ORDER
UNITED KINGDOM—KEY DRIVERS OF OUR COUNTRY POWER SCORE
Overall Empire Score (0–1) Level: 0.27 Rank: 7
The Big Cycles Level Z-Score Rank Trajectory
Economic/Financial Position Unfavorable -1.7 9
Debt Burden High Debt -1.6 9
Expected Growth 0.9% -0.8 6
Internal Order Moderate Risk -0.2 8
Wealth/Opportunity/Values Gap Relatively Large -0.2 7
Internal Conflict Average -0.3 7
External Order
Eight Key Measures of Power
Reserve Currency Status Weak -0.6 4
Markets & Financial Center Average 0.0 5
Cost Competitiveness Average -0.3 5
Education Average -0.2 6
Economic Output Average -0.3 6
Innovation & Technology Average -0.3 7
Trade Weak -0.6 7
Military Strength Average -0.3 8
Additional Measures of Power
Governance/Rule of Law Strong 1.2 1
Resource-Allocation Efficiency Average 0.3 4
Character/Determination/Civility Average -0.4 7
Infrastructure & Investment Weak -0.6 10
Geology Weak -0.9 10
Acts of Nature Average 0.4 4
Getting better Getting worse Flat

108
THE CHANGING WORLD ORDER
FRANCE—KEY DRIVERS OF OUR COUNTRY POWER SCORE
Overall Empire Score (0–1) Level: 0.25 Rank: 8
The Big Cycles Level Z-Score Rank Trajectory
Economic/Financial Position Unfavorable -1.2 8
Debt Burden
Moderately
High Debt
-0.8 8
Expected Growth 0.4% -0.9 7
Internal Order Low Risk 0.5 4
Wealth/Opportunity/Values Gap Narrow 1.1 1
Internal Conflict Average -0.1 6
External Order
Eight Key Measures of Power
Trade Average -0.5 6
Military Strength Average -0.3 7
Markets & Financial Center Average -0.3 7
Education Average -0.5 7
Innovation & Technology Average -0.5 8
Economic Output Weak -0.5 9
Cost Competitiveness Weak -0.6 9
Reserve Currency Status
Additional Measures of Power
Infrastructure & Investment Average -0.2 5
Governance/Rule of Law Average 0.3 6
Geology Average -0.5 7
Resource-Allocation Efficiency Weak -1.3 10
Character/Determination/Civility Weak -1.5 11
Acts of Nature Average 0.0 6
Getting better Getting worse Flat

109
THE CHANGING WORLD ORDER
NETHERLANDS—KEY DRIVERS OF OUR COUNTRY POWER SCORE
Overall Empire Score (0–1) Level: 0.25 Rank: 9
The Big Cycles
Level Z-Score Rank Trajectory
Economic/Financial Position
Somewhat
Favorable
0.0 5
Debt Burden Low Debt 0.8 3
Expected Growth 1.0% -0.8 5
Internal Order Low Risk 0.9 2
Wealth/Opportunity/Values Gap Narrow 0.6 4
Internal Conflict Low 1.2 1
External Order
Eight Key Measures of Power
Innovation & Technology Average -0.3 6
Economic Output Average -0.3 8
Markets & Financial Center Weak -0.5 8
Trade Weak -0.6 8
Education Weak -0.7 9
Cost Competitiveness Weak -0.8 11
Military Strength Very Weak -1.9 11
Reserve Currency Status
Additional Measures of Power
Governance/Rule of Law Strong 1.0 2
Character/Determination/Civility Average -0.3 6
Geology Average -0.5 6
Resource-Allocation Efficiency Average -0.1 8
Infrastructure & Investment Average -0.4 8
Acts of Nature Average 0.5 3
Getting better Getting worse Flat

110
THE CHANGING WORLD ORDER
RUSSIA—KEY DRIVERS OF OUR COUNTRY POWER SCORE
Overall Empire Score (0–1) Level: 0.23 Rank: 10
The Big Cycles
Level Z-Score Rank Trajectory
Economic/Financial Position
Somewhat
Favorable
0.5 2
Debt Burden Low Debt 1.0 2
Expected Growth 2.5% -0.2 3
Internal Order Moderate Risk -0.5 9
Wealth/Opportunity/Values Gap
Internal Conflict Average -0.5 9
External Order
Eight Key Measures of Power
Cost Competitiveness Strong 0.7 3
Military Strength Average 0.4 3
Reserve Currency Status Weak -0.8 6
Education Weak -0.5 8
Innovation & Technology Weak -0.7 9
Trade Weak -0.9 10
Markets & Financial Center Weak -1.1 11
Economic Output Weak -1.4 11
Additional Measures of Power
Geology Very Strong 1.9 1
Resource-Allocation Efficiency Strong 1.3 1
Character/Determination/Civility Average 0.1 5
Infrastructure & Investment Weak -1.0 11
Governance/Rule of Law Very Weak -1.9 11
Acts of Nature Average -0.1 7
Getting better Getting worse Flat

111
THE CHANGING WORLD ORDER
SPAIN—KEY DRIVERS OF OUR COUNTRY POWER SCORE
Overall Empire Score (0–1) Level: 0.20 Rank: 11
The Big Cycles Level Z-Score Rank Trajectory
Economic/Financial Position Unfavorable -1.9 11
Debt Burden High Debt -1.7 10
Expected Growth 0.0% -1.1 10
Internal Order Moderate Risk 0.0 6
Wealth/Opportunity/Values Gap Typical 0.4 5
Internal Conflict Average -0.4 8
External Order
Eight Key Measures of Power
Cost Competitiveness Weak -0.6 7
Markets & Financial Center Weak -0.6 9
Military Strength Weak -0.8 10
Economic Output Weak -0.9 10
Education Weak -0.9 10
Innovation & Technology Weak -1.0 10
Trade Weak -0.9 11
Reserve Currency Status
Additional Measures of Power
Geology Weak -0.6 8
Infrastructure & Investment Weak -0.6 9
Governance/Rule of Law Weak -0.7 9
Character/Determination/Civility Weak -1.0 9
Resource-Allocation Efficiency Weak -1.6 11
Acts of Nature Weak -0.7 10
Getting better Getting worse Flat
