
Country Power
Index 2022
RAY DALIO
© 2022 RAY DALIO
THE CHANGING
WORLD ORDER
COUNTRY POWER INDEX 2022
1
A
s I described in my book Principles for Dealing with the Changing World Order, I automated my way
of looking at the cause/effect relationships that are driving both improvements in and worsenings
of countries’ conditions so that data is fed into a computer that analyzes it and writes a summary
of the current conditions and the long-term prospects for each country. is is done for the world’s
24 leading countries. To understand how it works and how I use it, imagine you are a chess player and that you
built a computerized version of your thinking process that analyzes and makes moves next to you while you also
think through the moves you’d make. While it reflects your thinking, has perfect memory, and can process vast
amounts of data almost instantaneously, the computer has no common sense and isn’t able to pick up on subtle,
non-quantifiable relationships. Your mind and the computer each bring different strengths and weaknesses that
make you together far better than either of you alone. at’s what it’s like.
In my book I showed the computerized assessment of 11 major powers and promised to share updated
versions for 24 countries—those in the G20 plus others that scored as notable global powers—at least annually
on economicprinciples.org. at’s what I’m now doing.
In this memo, I start by showing summary tables of scores of the 18 major determinants across countries
(see Principles for Dealing with the Changing World Order for more details). After that, I show the computer-
generated summaries that describe each country. e text for each country highlights a few of the major gauges
and a few of the stats within each gauge that reflect the broad trends I am seeing. Of course there is a great deal
more below these summaries that I can delve into, though these summaries are good enough for our purposes.
e overall country power score is created by weighing the outputs of the 18 gauges, each of which is
derived as a composite of several stats we aggregate based on relevance, quality, and consistency across countries
and time. Because both the size of a country and the strength of the powers matter, I show measures of the
total power and the per capita power of each country. For more detail on how I these about different types
of measures (in per capita and absolute terms), please see the table at the end of this report, following the
computer-generated country summaries.
To be clear, while these indices aren’t perfect because the data through time isn’t perfect and not everything
can be captured in the data, they do an excellent job of painting the big picture. Additionally, it is worth noting
that we have updated and improved the analysis since the book was published, which is why you may notice
some figures differ slightly in this report compared to the publication. is system is a never-ending work in
progress so you should expect it to evolve and continuously get better. I hope that you will find it as helpful as I
find it. I also hope that these objective measures will lead to people objectively assessing policy makers’ moves
and that that will lead either to better policies or to better policy makers who will make better policies.
[As of April 2022]
EXPANDED ANALYSIS OF THE
CONDITIONS OF, AND PROSPECTS FOR,
THE WORLD’S LEADING COUNTRIES

THE CHANGING WORLD ORDER
2
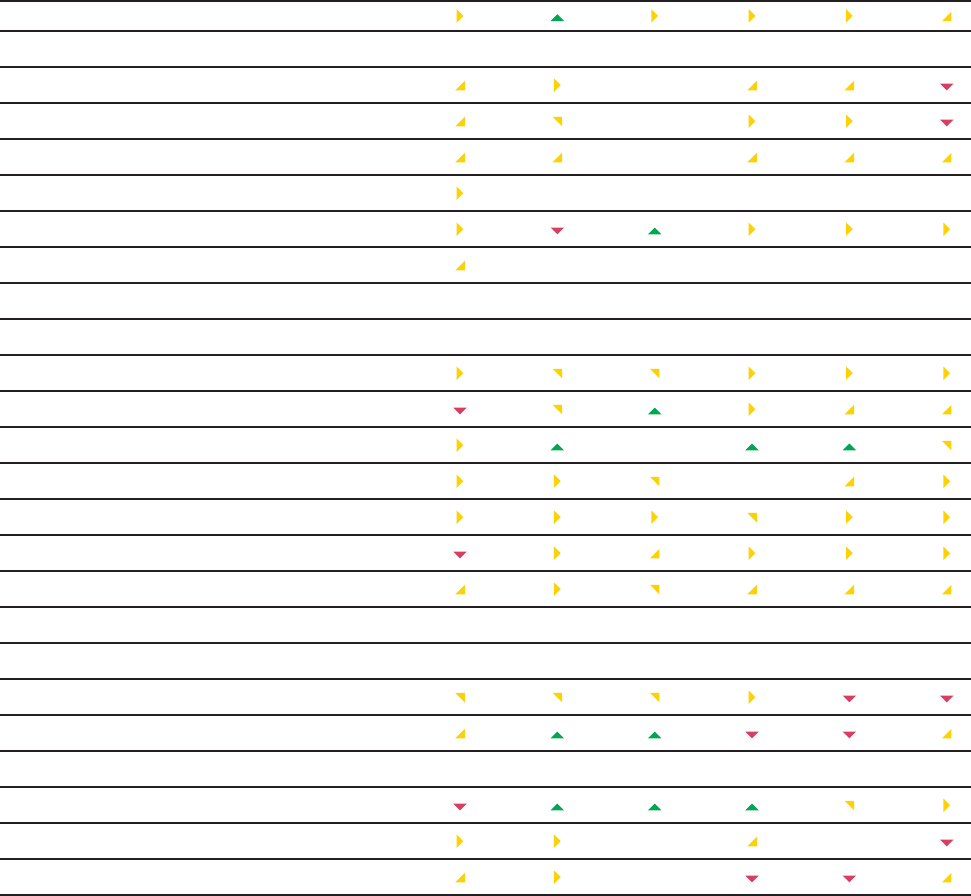
CURRENT READINGS ACROSS MAJOR POWERS
(Z-Score and 20-Year Change Denoted by Arrows)
GAUGE
QUALITY
USA CHN EUR DEU JPN KOR
EMPIRE SCORE (0–1) 0.89
0.76 0.58 0.38 0.33 0.31
THE BIG CYCLES
Economic/Financial Position Reliable -1.5
0.3 -0.9 -0.1 -1.3 0.1
Debt Burden (Big Economic Cycle) Reliable -1.9 0.0 -0.6 0.8 -1.0 0.5
Expected Growth (Big Economic Cycle) Reliable -0.6 0.4 -1.0 -1.0 -1.1 -0.4
Internal Order So-So -2.0 0.2 0.2 0.8 1.1 --- ---
Gaps in Wealth, Opportunity & Values So-So -1.8
0.2 0.1 0.8 1.0 0.0
Internal Conflict
1
(Internal Order; low is bad) Reliable -2.2 0.1 0.3 0.7 1.2 --- ---
External Order
2
So-So -1.3 -1.3 0.3 0.3 0.4 --- ---
KEY EIGHT MEASURES OF POWER
Education Reliable 2.0
1.7 0.4 -0.2 0.1 0.1
Innovation & Technology Reliable 2.1 1.6 0.2 -0.2 0.1 0.2
Cost Competitiveness Reliable -0.4 1.1 -0.6 -0.6 -0.3 0.1
Military Strength Reliable 2.0 0.9 0.4 -0.7 -0.4 -0.4
Trade Reliable 1.1 1.9 1.3 0.5 -0.5 -0.7
Economic Output Reliable 1.7 1.5 1.0 -0.1 -0.1 -0.9
Markets & Financial Center Reliable 2.7 0.2 0.4 -0.2 0.1 -0.6
Reserve Currency Status
3
Reliable 1.9 -0.6 0.3 --- --- -0.5 -0.7 ---
ADDITIONAL MEASURES OF POWER
Geology Reliable 1.6
0.5 -0.6 -0.7 -1.0 -0.9
Resource-Allocation Efficiency So-So 1.4 0.8 -0.8 1.0 0.6 -0.5
Acts of Nature So-So -0.2 --- -0.1 --- 0.1 --- 1.1 --- 1.5 --- 1.6 ---
Infrastructure & Investment Reliable 0.7
2.6 0.4 -0.3 -0.2 0.0
Character/Civility/Determination So-So 1.0 1.6 -1.0 -0.4 0.4 1.0
Governance/Rule of Law Reliable 0.7 -0.6 -0.5 --- 0.7 0.8 -0.2
1
We are still working to expand our internal and external conflict determinants across all countries.
2
External Order based on external conflict gauge vs the global hegemon (USA) or rising power (CHN) as of April 2022.
3
We did not give individual Eurozone countries reserve currency status scores.
ALL THE MAJOR DETERMINANTS ACROSS THE WORLD
e tables on the following pages paint a rich picture of what’s happening and what is likely to happen across
an expanded set of 24 major countries. While this table might look like a bunch of numbers and arrows at first
glance, when you get into it a clearer picture will emerge. In my book, I discuss the determinants in greater
depth in the Determinants Addendum (Chapter 2) and e Future (Chapter 14). e quality of the gauges
in representing the concepts varies. In order to convey the reliability of each gauge, we indicate whether it’s
reliable or so-so. e following page describes how to read the tables.

COUNTRY POWER INDEX 2022
3
CURRENT READINGS ACROSS MAJOR POWERS
(Z-Score and 20-Year Change Denoted by Arrows)
GAUGE
QUALITY
IND GBR FRA RUS SGP CAN
EMPIRE SCORE (0–1) 0.28
0.27 0.26 0.26 0.22 0.22
THE BIG CYCLES
Economic/Financial Position Reliable 1.1
-1.5 -1.0 0.7 --- 0.8 -0.6
Debt Burden (Big Economic Cycle) Reliable 0.5 -1.8 -0.8 1.2 1.6 -0.3
Expected Growth (Big Economic Cycle) Reliable 1.1 -0.7 -0.9 -0.2 --- -0.4 -0.7
Internal Order So-So --- --- -0.3 0.5 -1.2 --- --- --- ---
Gaps in Wealth, Opportunity & Values So-So -0.3
-0.3 1.1 -1.8 -2.1 -0.2
Internal Conflict
1
(Internal Order; low is bad) Reliable --- --- -0.3 -0.1 -0.5 --- --- --- ---
External Order
2
So-So --- --- 0.4 --- --- -2.1 --- --- --- ---
KEY EIGHT MEASURES OF POWER
Education Reliable -1.1
-0.3 -0.5 -0.5 -0.5 -0.2
Innovation & Technology Reliable -1.1 -0.3 -0.5 -0.7 -0.6 -0.6
Cost Competitiveness Reliable 2.4 -0.4 -0.6 0.7 --- 0.2 -0.5
Military Strength Reliable 0.3 -0.2 -0.1 0.6 -2.1 -0.9
Trade Reliable -0.8 -0.5 -0.5 -0.9 -0.7 -0.8
Economic Output Reliable 0.1 -0.6 -0.6 -0.5 -1.5 -1.1
Markets & Financial Center Reliable -0.7 0.0 -0.3 -1.0 -0.4 -0.4
Reserve Currency Status
3
Reliable -0.7 -0.5 --- --- -0.7 --- -0.7 --- -0.6 ---
ADDITIONAL MEASURES OF POWER
Geology Reliable 0.3
-0.8 -0.5 2.1 -0.6 0.7
Resource-Allocation Efficiency So-So 0.3 -0.3 -1.6 -0.1 --- 2.4 0.5
Acts of Nature So-So -2.4 --- 0.3 --- 0.0 -0.1 --- -0.3 --- 1.2 ---
Infrastructure & Investment Reliable -0.3
-0.7 -0.2 -1.0 -0.2 -0.7
Character/Civility/Determination So-So 1.3 -0.3 -1.5 0.2 --- 2.4 0.1
Governance/Rule of Law Reliable -1.1 1.2 0.3 -1.9 2.3 0.7
1
We are still working to expand our internal and external conflict determinants across all countries.
2
External Order based on external conflict gauge vs the global hegemon (USA) or rising power (CHN) as of April 2022.
3
We did not give individual Eurozone countries reserve currency status scores.
e first column shows the determinant being measured. ere are other determinants that aren’t shown
because they are either too subjective or too difficult to quantify (e.g., leadership). e quality of leadership
can’t be measured as objectively as the amount of economic output (e.g., how can you measure whether Donald
Trump was a good leader or a bad one?). e rest of the columns show each country’s score on each determinant,
as well as the recent trend in that score; where we do not have enough data to make a gauge or enough history
to display an arrow, we show dashes to indicate no reading.

THE CHANGING WORLD ORDER
4
CURRENT READINGS ACROSS MAJOR POWERS
(Z-Score and 20-Year Change Denoted by Arrows)
GAUGE
QUALITY
AUS CHE TUR BRZ ITA NLD
EMPIRE SCORE (0–1) 0.22
0.21 0.18 0.18 0.17 0.16
THE BIG CYCLES
Economic/Financial Position Reliable -0.6
-0.1 --- -0.1 -0.4 -1.1 -0.5
Debt Burden (Big Economic Cycle) Reliable -0.7 0.4 -0.5 -0.2 -0.5 0.0
Expected Growth (Big Economic Cycle) Reliable -0.4 -0.7 --- 0.2 -0.4 -1.3 -0.9
Internal Order So-So --- --- --- --- --- --- --- --- --- --- 0.9
Gaps in Wealth, Opportunity & Values So-So 0.3 0.0 -1.1 -2.0 0.9 0.6
Internal Conflict
1
(Internal Order; low is bad) Reliable --- --- --- --- --- --- --- --- --- --- 1.3
External Order
2
So-So --- --- --- --- --- --- --- --- --- --- --- ---
KEY EIGHT MEASURES OF POWER
Education Reliable -0.5
-0.7 -1.7 -1.4 -0.9 -0.7
Innovation & Technology Reliable -0.6 -0.2 -1.0 -1.0 -0.8 -0.3
Cost Competitiveness Reliable -0.6 -0.6 0.9 0.6 -0.7 -0.8
Military Strength Reliable -0.9 -1.2 -0.6 -0.5 -0.7 -1.8
Trade Reliable -1.0 -0.8 -1.2 -1.1 -0.7 -0.6
Economic Output Reliable -1.3 -1.5 -0.7 -0.7 -0.7 -1.4
Markets & Financial Center Reliable -0.4 -0.3 -1.0 -1.0 -0.7 -0.5
Reserve Currency Status
3
Reliable -0.6 --- -0.7 -0.7 --- -0.7 --- --- --- --- ---
ADDITIONAL MEASURES OF POWER
Geology Reliable 1.9
-0.5 -0.6 1.6 -0.7 -0.4
Resource-Allocation Efficiency So-So -0.4 -0.5 -0.2 -1.3 -2.4 0.3
Acts of Nature So-So 1.4 --- 1.2 --- -0.1 --- -2.3 --- -0.9 --- 0.5 ---
Infrastructure & Investment Reliable -0.7
-0.1 -0.5 -1.1 -0.8 -0.4
Character/Civility/Determination So-So 0.1 0.4 0.0 -0.8 -1.4 -0.3
Governance/Rule of Law Reliable 0.9 1.2 -1.2 -2.3 -1.9 1.0
1
We are still working to expand our internal and external conflict determinants across all countries.
2
External Order based on external conflict gauge vs the global hegemon (USA) or rising power (CHN) as of April 2022.
3
We did not give individual Eurozone countries reserve currency status scores.
COUNTRY POWER INDEX 2022
5
CURRENT READINGS ACROSS MAJOR POWERS
(Z-Score and 20-Year Change Denoted by Arrows)
GAUGE
QUALITY
ESP IDN SAU MEX SAF ARG
EMPIRE SCORE (0–1) 0.16
0.15 0.14 0.13 0.09 0.05
THE BIG CYCLES
Economic/Financial Position Reliable -1.3
1.0 1.9 --- 0.3 0.2 -1.0
Debt Burden (Big Economic Cycle) Reliable -1.1 0.6 1.9 --- 0.3 0.2 -0.9
Expected Growth (Big Economic Cycle) Reliable -1.1 0.9 --- --- 0.1 0.0 -0.7
Internal Order So-So 0.0 --- --- --- --- --- --- --- --- --- ---
Gaps in Wealth, Opportunity & Values So-So 0.4
0.1 -3.0 -1.8 -2.8 0.1
Internal Conflict
1
(Internal Order; low is bad) Reliable -0.4 --- --- --- --- --- --- --- --- --- ---
External Order
2
So-So --- --- --- --- --- --- --- --- --- --- --- ---
KEY EIGHT MEASURES OF POWER
Education Reliable -0.9
-1.9 -1.4 -1.3 -1.8 -1.7
Innovation & Technology Reliable -1.0 -1.2 -1.4 -1.3 -1.2 -1.2
Cost Competitiveness Reliable -0.6 2.0 --- --- 0.8 0.8 0.4
Military Strength Reliable -0.9 -0.8 -0.6 -2.1 --- -1.3 -2.1
Trade Reliable -0.9 -1.2 -1.2 -0.9 -1.3 -1.3
Economic Output Reliable -1.0 -0.8 -1.2 -0.8 -1.2 -1.2
Markets & Financial Center Reliable -0.7 -1.1 -1.1 -1.0 -1.0 -1.3
Reserve Currency Status
3
Reliable --- --- -0.7 --- -0.7 --- -0.7 --- -0.7 --- -0.7 ---
ADDITIONAL MEASURES OF POWER
Geology Reliable -0.5
0.4 0.3 -0.3 -0.2 -0.3
Resource-Allocation Efficiency So-So -1.5 1.0 -0.7 -0.3 -0.6 -2.4
Acts of Nature So-So -0.6 --- -2.1 --- -1.9 --- -1.1 --- -2.0 --- -2.0 ---
Infrastructure & Investment Reliable -0.6
-0.6 -0.6 -1.0 -1.1 -1.5
Character/Civility/Determination So-So -0.9 1.3 --- --- 1.3 -0.5 --- -0.7
Governance/Rule of Law Reliable -0.7 -1.3 --- --- -2.3 -1.5 -2.3
1
We are still working to expand our internal and external conflict determinants across all countries.
2
External Order based on external conflict gauge vs the global hegemon (USA) or rising power (CHN) as of April 2022.
3
We did not give individual Eurozone countries reserve currency status scores.
THE CHANGING WORLD ORDER
6
THE POWERS AND PROSPECTS OF THE UNITED STATES
is is our computer generated reading for the United States as of January 2022.
Based on the latest readings of key indicators, the United States appears to be a strong power (#1 among major
countries today) in gradual decline. As shown in the table below, the key strengths of the United States that
put it in this position are its strong capital markets and financial center, its innovation/technology, its strong
military, its high level of education, its reserve currency status, its high economic output, and its wealth of
natural resources. Its weaknesses are its unfavorable economic/financial position and its large domestic con-
flicts. e eight major measures of power are very strong today but are, in aggregate, falling slowly.
e table below shows our aggregate country power gauge and the major drivers, as well as the rank of each
measure of power across 24 major countries today and the trajectory over the past twenty years.
To understand a country, we start by looking at the big cycles, as well as measures of power that both reflect
and drive the rise and fall of a country. While we refer to these factors individually, they are not separate; they
interact with and reinforce one another to move a country along its cycle.
For the United States, the big cycles look mostly unfavorable.
e United States is in an unfavorable position in its economic and financial cycles, with a high debt burden
and relatively low expected real growth over the next 10 years (1.3% per year). e United States has significantly
more foreign debts than foreign assets (net IIP is -68% of GDP). Non-financial debt levels are high (274% of
GDP), and government debt levels are high (127% of GDP). e bulk (99%) of these debts are in its own currency,
which mitigates its debt risks. e ability to use interest rate cuts to stimulate the economy is low (short rates at
0.1%), and the country is already printing money to monetize debt. at said, being the world’s leading reserve
currency is a large benefit to the US. If this were to change, it would significantly weaken the US position.
Internal disorder is a high risk. Wealth, income, and values gaps are large (relative to countries of similar per
capita income levels). Regarding Inequality—the top 1% and top 10% in the United States capture 19% and
45% of income (respectively the 8th and 11th highest share across major countries). Our internal conflict gauge
is very high. is gauge measures actual conflict events (i.e., protests), political conflict (i.e., partisanship), and
general discontent (based on surveys).
External disorder is a risk. Most importantly, the United States and China, which is fast-rising and the #2
power (all things considered), are having significant conflict as measured by our external conflict gauge. One
example of this is that 79% of Americans today have an unfavorable view of China (up from 45% in 2018).
Looking in more detail at the eight key measures of power—the United States has the largest capital mar-
kets and the strongest financial center among major countries. Its equity markets are a majority of the world
total (59% of total market cap and 66% of volume), and a majority of global transactions happen in USD (55%).
In addition, the United States has the strongest reading on our measures of technology and innovation
among major countries. A moderately large share (14%) of global patent applications, a large share (27%)
of global R&D spending, and a large share (27%) of global researchers are in the United States. e United

COUNTRY POWER INDEX 2022
7
UNITED STATES—KEY DRIVERS OF OUR COUNTRY POWER SCORE
Overall Empire Score (0–1) Level: 0.89 Rank: 1
The Big Cycles Level Z-Score Rank Trajectory
Economic/Financial Position Unfavorable -1.5 23
Debt Burden High Debt -1.9 24
Expected Growth 1.3% -0.6 12
Internal Order High Risk -2.0 10
Wealth/Opportunity/Values Gap Large -1.8 19
Internal Conflict Very High -2.2 10
External Order At Risk -1.3 -
Eight Key Measures of Power
Markets & Financial Center Very Strong 2.7 1
Innovation & Technology Very Strong 2.1 1
Military Strength Very Strong 2.0 1
Education Very Strong 2.0 1
Reserve Currency Status Very Strong 1.9 1
Economic Output Very Strong 1.7 1
Trade Strong 1.1 3
Cost Competitiveness Average -0.4 14
Additional Measures of Power
Resource-Allocation Efficiency Strong 1.4 1
Infrastructure & Investment Strong 0.7 2
Geology Strong 1.6 4
Character/Determination/Civility Strong 1.0 6
Governance/Rule of Law Strong 0.7 9
Acts of Nature Average -0.2 14
-
Getting better Getting worse Flat
States also has the strongest military among major countries. A large share (40%) of global military spend-
ing is by the United States, and it has a moderate share (7%) of the world’s military personnel. e United States
also has a mix of other strengths, detailed in the table above.
Note: With this page, I am calling out a few of the major gauges and a few of the stats within each gauge that reect
the broad trends we are seeing. e aggregate gauges and nal country power score I am showing include hundreds of
individual stats that we aggregate based on relevance, quality, and consistency across countries and time. To best capture
the overall strength of a country, I gave considerations to both quantity and quality, but structured things to best capture
who would win in a competition or war.
Note: All ranks shown are out of 24, except in the case of Internal Conict & Internal Order (out of 10) and Reserve
Status (out of 19).
THE CHANGING WORLD ORDER
8
THE POWERS AND PROSPECTS OF CHINA
is is our computer generated reading for China as of January 2022.
Based on the latest readings of key indicators, China appears to be a strong power (#2 among major countries
today) in rapid ascent. As shown in the table below, the key strengths of China that put it in this position
are its infrastructure and investment, its importance to global trade, its high level of education, its innova-
tion/technology, its people’s self-sufficiency and strong work ethic, and its strong military. e eight major
measures of power are somewhat strong today and are, in aggregate, rising rapidly. In particular, China’s im-
portance to global trade, its innovation and technology, and its importance as a financial center are increasing.
e table below shows our aggregate country power gauge and the major drivers, as well as the rank of each
measure of power across 24 major countries today and the trajectory over the past twenty years.
To understand a country, we start by looking at the big cycles, as well as measures of power that both reflect
and drive the rise and fall of a country. While we refer to these factors individually, they are not separate; they
interact with and reinforce one another to move a country along its cycle.
For China, the big cycles look somewhat favorable.
China is in a somewhat favorable position in its economic and financial cycles, with a moderately low debt
burden and relatively high expected real growth over the next 10 years (4.3% per year). China has slightly more
foreign assets than foreign debts (net IIP is 11% of GDP). Non-financial debt levels are high (267% of GDP),
though government debt levels are typical for major countries today (49% of GDP). e bulk (97%) of these
debts are in its own currency, which mitigates its debt risks. e ability to use interest rate cuts to stimulate the
economy is modest (short rates at 2.1%).
Internal disorder is a low risk. Wealth, income, and values gaps are typical (relative to countries of similar per
capita income levels). Regarding Inequality—the top 1% and top 10% in China capture 14% and 42% of income
(respectively the 14th and 13th highest share across major countries). Our internal conflict gauge is average.
is gauge measures actual conflict events (i.e., protests), political conflict (i.e., partisanship), and general dis-
content (based on surveys).
External disorder is a risk. Most importantly, China and the United States, which is declining but remains
the #1 power (all things considered), are having significant conflict as measured by our external conflict gauge.
Looking in more detail at the eight key measures of power—China is the largest exporter among major
countries. It exports 14% of global exports. In addition, China has the second strongest position in edu-
cation among major countries. China has a large share of the world’s bachelor’s degrees (20%). China also
has the second strongest reading on our measures of technology and innovation among major countries.
A majority (58%) of global patent applications, a large share (23%) of global R&D spending, and a large share
(23%) of global researchers are in China. China also has a mix of other strengths, detailed in the table above.

COUNTRY POWER INDEX 2022
9
CHINA—KEY DRIVERS OF OUR COUNTRY POWER SCORE
Overall Empire Score (0–1) Level: 0.76 Rank: 2
The Big Cycles Level Z-Score Rank Trajectory
Economic/Financial Position Somewhat Favorable 0.3 7
Debt Burden Moderately Low Debt -0.0 11
Expected Growth 4.3% 0.4 3
Internal Order Low Risk 0.2 6
Wealth/Opportunity/Values Gap Typical 0.2 8
Internal Conflict Average 0.1 5
External Order At Risk -1.3 -
Eight Key Measures of Power
Trade Very Strong 1.9 1
Education Very Strong 1.7 2
Innovation & Technology Strong 1.6 2
Economic Output Strong 1.5 2
Military Strength Strong 0.9 2
Cost Competitiveness Strong 1.1 3
Markets & Financial Center Average 0.2 3
Reserve Currency Status Weak -0.6 5
Additional Measures of Power
Infrastructure & Investment Very Strong 2.6 1
Character/Determination/Civility Strong 1.6 2
Resource-Allocation Efficiency Strong 0.8 3
Geology Strong 0.5 6
Governance/Rule of Law Weak -0.6 13
Acts of Nature Average -0.1 12
-
Getting better Getting worse Flat
Note: With this page, I am calling out a few of the major gauges and a few of the stats within each gauge that reect
the broad trends we are seeing. e aggregate gauges and nal country power score I am showing include hundreds of
individual stats that we aggregate based on relevance, quality, and consistency across countries and time. To best capture
the overall strength of a country, I gave considerations to both quantity and quality, but structured things to best capture
who would win in a competition or war.
Note: All ranks shown are out of 24, except in the case of Internal Conict & Internal Order (out of 10) and Reserve
Status (out of 19).
THE CHANGING WORLD ORDER
10
THE POWERS AND PROSPECTS OF EUROZONE
is is our computer generated reading for Eurozone as of January 2022.
Based on the latest readings of key indicators, Eurozone appears to be a strong power (#3 among major
countries today) in gradual decline. As shown in the table below, the key strengths of Eurozone are its
importance to global trade, its strong capital markets and financial center, and its reserve currency status.
Its weaknesses are its people’s lower than average work ethic and low self-sufficiency and its relatively poor
allocation of labor and capital. e eight major measures of power are somewhat strong today but are, in ag-
gregate, falling slowly.
e table below shows our aggregate country power gauge and the major drivers, as well as the rank of each
measure of power across 24 major countries today and the trajectory over the past twenty years.
To understand a country, we start by looking at the big cycles, as well as measures of power that both reflect
and drive the rise and fall of a country. While we refer to these factors individually, they are not separate; they
interact with and reinforce one another to move a country along its cycle.
For Eurozone, the big cycles look somewhat unfavorable.
e Eurozone is in a moderately unfavorable position in its economic and financial cycles, with a moderately
high debt burden and very low expected real growth over the next 10 years (0.3% per year). e Eurozone has
similar levels of foreign debts and foreign assets (net IIP is -0% of GDP). Non-financial debt levels are typical for
major countries today (239% of GDP), though government debt levels are high (103% of GDP). e ability to use
interest rate cuts to stimulate the economy is very low (short rates at -0.6%), and the country is already printing
money to monetize debt.
Internal disorder is a low risk. Wealth, income, and values gaps are typical (relative to countries of similar per
capita income levels). Regarding Inequality—the top 1% and top 10% in the Eurozone capture 11% and 35%
of income (respectively the 21st and 18th highest share across major countries). Our internal conflict gauge
is average. is gauge measures actual conflict events (i.e., protests), political conflict (i.e., partisanship), and
general discontent (based on surveys).
Looking in more detail at the eight key measures of power—the Eurozone is the second largest exporter
among major countries. It exports 12% of global exports. In addition, the Eurozone has the second largest
capital markets and the second strongest financial center among major countries. Its equity markets are
a moderate share of the world total (8% of total market cap and 4% of volume), and a large share of global
transactions happen in EUR (30%). e Eurozone also has the second strongest reserve currency among
major countries. A large share of global currency reserves are in EUR (21%), and a large share of global debt
is denominated in EUR (17%).
is page reects our estimate of the power of the Eurozone in aggregate. For most stats, we’re using a aggregate across
the eight major countries in the Eurozone.

COUNTRY POWER INDEX 2022
11
EUROZONE—KEY DRIVERS OF OUR COUNTRY POWER SCORE
Overall Empire Score (0–1) Level: 0.58 Rank: 3
The Big Cycles Level Z-Score Rank Trajectory
Economic/Financial Position Moderately Unfavorable -0.9 17
Debt Burden Moderately High Debt -0.6 17
Expected Growth 0.3% -1.0 20
Internal Order Low Risk 0.2 5
Wealth/Opportunity/Values Gap Typical 0.1 9
Internal Conflict Average 0.3 4
External Order At Risk 0.3 -
Eight Key Measures of Power
Trade Strong 1.3 2
Markets & Financial Center Average 0.4 2
Reserve Currency Status Average 0.3 2
Economic Output Strong 1.0 3
Education Average 0.4 3
Innovation & Technology Average 0.2 3
Military Strength Average 0.4 4
Cost Competitiveness Weak -0.6 19
Additional Measures of Power
Infrastructure & Investment Average 0.4 3
Governance/Rule of Law Average -0.5 12 -
Resource-Allocation Efficiency Weak -0.8 18
Geology Weak -0.6 19
Character/Determination/Civility Weak -1.0 21
Acts of Nature Average 0.1 9 -
Getting better Getting worse Flat
Note: With this page, I am calling out a few of the major gauges and a few of the stats within each gauge that reect
the broad trends we are seeing. e aggregate gauges and nal country power score I am showing include hundreds of
individual stats that we aggregate based on relevance, quality, and consistency across countries and time. To best capture
the overall strength of a country, I gave considerations to both quantity and quality, but structured things to best capture
who would win in a competition or war.
Note: All ranks shown are out of 24, except in the case of Internal Conict & Internal Order (out of 10) and Reserve
Status (out of 19).
THE CHANGING WORLD ORDER
12
THE POWERS AND PROSPECTS OF GERMANY
is is our computer generated reading for Germany as of January 2022.
Based on the latest readings of key indicators, Germany appears to be a middle-of-the-pack power (#4 among
major countries today) on a flat trajectory. As shown in the table below, the key strengths of Germany are
its high internal order and its effective allocation of labor and capital. e eight major measures of power are
mixed today but are, in aggregate, moving sideways.
e table below shows our aggregate country power gauge and the major drivers, as well as the rank of each
measure of power across 24 major countries today and the trajectory over the past twenty years.
To understand a country, we start by looking at the big cycles, as well as measures of power that both reflect
and drive the rise and fall of a country. While we refer to these factors individually, they are not separate; they
interact with and reinforce one another to move a country along its cycle.
For Germany, the big cycles look somewhat favorable.
Germany is in a moderately unfavorable position in its economic and financial cycles, with a low debt burden
but very low expected real growth over the next 10 years (0.3% per year). Germany has significantly more foreign
assets than foreign debts (net IIP is 71% of GDP). Non-financial debt levels are typical for major countries today
(184% of GDP), and government debt levels are typical for major countries today (69% of GDP). Germany’s debts
are largely in euros, which increases Germany’s debt risks, since this is not a currency that Germany directly
controls. e ability to use interest rate cuts to stimulate the economy is low for the Eurozone (short rates are at
-0.6%), and Europe is already printing money to monetize debt.
Internal disorder is a low risk. Wealth, income, and values gaps are narrow (relative to countries of similar per
capita income levels). Regarding Inequality—the top 1% and top 10% in Germany capture 13% and 37% of in-
come (both the 16th highest share across major countries). Our internal conflict gauge is low. is gauge measures
actual conflict events (i.e., protests), political conflict (i.e., partisanship), and general discontent (based on surveys).
On the eight key measures of power, Germany looks mixed in aggregate. It has no particularly prominent
strengths or weaknesses that I will call out.
Note: With this page, I am calling out a few of the major gauges and a few of the stats within each gauge that reect
the broad trends we are seeing. e aggregate gauges and nal country power score I am showing include hundreds of
individual stats that we aggregate based on relevance, quality, and consistency across countries and time. To best capture
the overall strength of a country, I gave considerations to both quantity and quality, but structured things to best capture
who would win in a competition or war.

COUNTRY POWER INDEX 2022
13
GERMANY—KEY DRIVERS OF OUR COUNTRY POWER SCORE
Overall Empire Score (0–1) Level: 0.38 Rank: 4
The Big Cycles Level Z-Score Rank Trajectory
Economic/Financial Position Moderately Unfavorable -0.1 11
Debt Burden Low Debt 0.8 4
Expected Growth 0.3% -1.0 19
Internal Order Low Risk 0.8 3
Wealth/Opportunity/Values Gap Narrow 0.8 4
Internal Conflict Low 0.7 3
External Order At Risk 0.3 -
Eight Key Measures of Power
Trade Strong 0.5 4
Economic Output Average -0.1 6
Education Average -0.2 6
Innovation & Technology Average -0.2 6
Markets & Financial Center Average -0.2 6
Military Strength Weak -0.7 14
Cost Competitiveness Weak -0.6 20
Reserve Currency Status - - - -
Additional Measures of Power
Resource-Allocation Efficiency Strong 1.0 2
Governance/Rule of Law Strong 0.7 8
Infrastructure & Investment Average -0.3 10
Character/Determination/Civility Average -0.4 16
Geology Weak -0.7 21
Acts of Nature Strong 1.1 6
-
Getting better Getting worse Flat
Note: All ranks shown are out of 24, except in the case of Internal Conict & Internal Order (out of 10) and Reserve
Status (out of 19).
THE CHANGING WORLD ORDER
14
THE POWERS AND PROSPECTS OF JAPAN
is is our computer generated reading for Japan as of January 2022.
Based on the latest readings of key indicators, Japan appears to be a middle-of-the-pack power (#5 among
major countries today) in decline. As shown in the table below, the key strength of Japan is its high internal
order. Its weaknesses are its unfavorable economic/financial position and its relative lack of natural re-
sources. e eight major measures of power are mixed today but are, in aggregate, falling. In particular, Japan’s
share of global output, its importance to global trade, and its innovation and technology are declining.
e table below shows our aggregate country power gauge and the major drivers, as well as the rank of each
measure of power across 24 major countries today and the trajectory over the past twenty years.
To understand a country, we start by looking at the big cycles, as well as measures of power that both reflect
and drive the rise and fall of a country. While we refer to these factors individually, they are not separate; they
interact with and reinforce one another to move a country along its cycle.
For Japan, the big cycles look mixed.
Japan is in an unfavorable position in its economic and financial cycles, with a high debt burden and very
low expected real growth over the next 10 years (0.0% per year). Japan has significantly more foreign assets than
foreign debts (net IIP is 70% of GDP). Non-financial debt levels are very high (403% of GDP), and government
debt levels are very high (240% of GDP). e bulk (99%) of these debts are in its own currency, which mitigates
its debt risks. e ability to use interest rate cuts to stimulate the economy is very low (short rates at -0.1%), and
the country is already printing money to monetize debt.
Internal disorder is a low risk. Wealth, income, and values gaps are narrow (relative to countries of similar per
capita income levels). Regarding Inequality—the top 1% and top 10% in Japan capture 13% and 45% of income
(respectively the 15th and 12th highest share across major countries). Our internal conflict gauge is low. is
gauge measures actual conflict events (i.e., protests), political conflict (i.e., partisanship), and general discontent
(based on surveys).
On the eight key measures of power, Japan looks mixed in aggregate. It has no particularly prominent
strengths or weaknesses that I will call out.
Note: With this page, I am calling out a few of the major gauges and a few of the stats within each gauge that reect
the broad trends we are seeing. e aggregate gauges and nal country power score I am showing include hundreds of
individual stats that we aggregate based on relevance, quality, and consistency across countries and time. To best capture
the overall strength of a country, I gave considerations to both quantity and quality, but structured things to best capture
who would win in a competition or war.

COUNTRY POWER INDEX 2022
15
JAPAN—KEY DRIVERS OF OUR COUNTRY POWER SCORE
Overall Empire Score (0–1) Level: 0.33 Rank: 5
The Big Cycles Level Z-Score Rank Trajectory
Economic/Financial Position Unfavorable -1.3 21
Debt Burden High Debt -1.0 20
Expected Growth 0.0% -1.1 22
Internal Order Low Risk 1.1 1
Wealth/Opportunity/Values Gap Narrow 1.0 2
Internal Conflict Low 1.2 2
External Order At Risk 0.4 -
Eight Key Measures of Power
Reserve Currency Status Average -0.5 3
Education Average 0.1 4
Markets & Financial Center Average 0.1 4
Innovation & Technology Average 0.1 5
Economic Output Average -0.1 5
Trade Average -0.5 5
Military Strength Average -0.4 8
Cost Competitiveness Average -0.3 12
Additional Measures of Power
Resource-Allocation Efficiency Strong 0.6 5
Governance/Rule of Law Strong 0.8 6
Infrastructure & Investment Average -0.2 6
Character/Determination/Civility Average 0.4 9
Geology Weak -1.0 24
Acts of Nature Strong 1.5 2
-
Getting better Getting worse Flat
Note: All ranks shown are out of 24, except in the case of Internal Conict & Internal Order (out of 10) and Reserve
Status (out of 19).
THE CHANGING WORLD ORDER
16
THE POWERS AND PROSPECTS OF KOREA
is is our computer generated reading for Korea as of January 2022.
Based on the latest readings of key indicators, Korea appears to be a middle-of-the-pack power (#6 among
major countries today) in gradual ascent. As shown in the table below, the key weaknesses of Korea are its
relative lack of natural resources and its relatively small economy. e eight major measures of power are
somewhat weak today but are, in aggregate, rising slowly. In particular, Korea’s share of global output, its inno-
vation and technology, and its relative military strength are increasing.
e table below shows our aggregate country power gauge and the major drivers, as well as the rank of each
measure of power across 24 major countries today and the trajectory over the past twenty years.
To understand a country, we start by looking at the big cycles, as well as measures of power that both reflect
and drive the rise and fall of a country. While we refer to these factors individually, they are not separate; they
interact with and reinforce one another to move a country along its cycle.
For Korea, the big cycles look mixed.
Korea is in a somewhat favorable position in its economic and financial cycles, with a low debt burden but
relatively low expected real growth over the next 10 years (1.9% per year). Korea has modestly more foreign assets
than foreign debts (net IIP is 27% of GDP). Non-financial debt levels are high (280% of GDP), though govern-
ment debt levels are typical for major countries today (44% of GDP). e bulk (97%) of these debts are in its own
currency, which mitigates its debt risks. e ability to use interest rate cuts to stimulate the economy is modest
(short rates at 1.2%).
At this time, we do not have a read on internal disorder for Korea because we do not have an internal conflict
gauge. Wealth, income, and values gaps are relatively large (relative to countries of similar per capita income
levels). Regarding Inequality—the top 1% and top 10% in Korea capture 15% and 47% of income (respectively
the 12th and 8th highest share across major countries).
Looking in more detail at the eight key measures of power, we would call out its relatively small economy.
Note: With this page, I am calling out a few of the major gauges and a few of the stats within each gauge that reect
the broad trends we are seeing. e aggregate gauges and nal country power score I am showing include hundreds of
individual stats that we aggregate based on relevance, quality, and consistency across countries and time. To best capture
the overall strength of a country, I gave considerations to both quantity and quality, but structured things to best capture
who would win in a competition or war.

COUNTRY POWER INDEX 2022
17
KOREA—KEY DRIVERS OF OUR COUNTRY POWER SCORE
Overall Empire Score (0–1) Level: 0.31 Rank: 6
The Big Cycles Level Z-Score Rank Trajectory
Economic/Financial Position Somewhat Favorable 0.1 9
Debt Burden Low debt 0.5 7
Expected Growth 1.9% -0.4 10
Internal Order - - - -
Wealth/Opportunity/Values Gap Relatively Large 0.0 12
Internal Conflict - - - -
External Order At Risk - - -
Eight Key Measures of Power
Innovation & Technology Average 0.2 4
Education Average 0.1 5
Military Strength Average -0.4 9
Trade Weak -0.7 9
Cost Competitiveness Average 0.1 11
Markets & Financial Center Weak -0.6 13
Reserve Currency Status Weak -0.7 15 -
Economic Output Weak -0.9 15
Additional Measures of Power
Infrastructure & Investment Average 0.0 4
Character/Determination/Civility Strong 1.0 7
Governance/Rule of Law Average -0.2 11
Resource-Allocation Efficiency Average -0.5 16
Geology Weak -0.9 21
Acts of Nature Strong 1.6 1
-
Getting better Getting worse Flat
Note: All ranks shown are out of 24, except in the case of Internal Conict & Internal Order (out of 10) and Reserve
Status (out of 19).
THE CHANGING WORLD ORDER
18
THE POWERS AND PROSPECTS OF INDIA
is is our computer generated reading for India as of January 2022.
Based on the latest readings of key indicators, India appears to be a middle-of-the-pack power (#7 among
major countries today) in ascent. As shown in the table below, the key strengths of India are its strong eco-
nomic and financial position and its cost-competitive labor (on a quality-adjusted basis). Its weaknesses
are its poor innovation and technology for its size population, its weak relative position in education, and
its corruption and inconsistent rule of law. e eight major measures of power are mixed today but are, in
aggregate, rising. In particular, India’s relative military strength, its innovation and technology, and its impor-
tance as a financial center are increasing.
e table below shows our aggregate country power gauge and the major drivers, as well as the rank of each
measure of power across 24 major countries today and the trajectory over the past twenty years.
To understand a country, we start by looking at the big cycles, as well as measures of power that both reflect
and drive the rise and fall of a country. While we refer to these factors individually, they are not separate; they
interact with and reinforce one another to move a country along its cycle.
For India, the big cycles look somewhat favorable, though we have a limited read.
India is in a highly favorable position in its economic and financial cycles, with a low debt burden and high
expected real growth over the next 10 years (6.4% per year). India has slightly more foreign debts than foreign
assets (net IIP is -12% of GDP). Non-financial debt levels are low (122% of GDP), though government debt levels
are typical for major countries today (75% of GDP). e bulk (94%) of these debts are in its own currency, which
mitigates its debt risks.
At this time, we do not have a read on internal disorder for India because we do not have an internal conflict
gauge. Wealth, income, and values gaps are relatively large (relative to countries of similar per capita income lev-
els). Regarding Inequality—the top 1% and top 10% in India capture 22% and 57% of income (respectively the
3rd and 4th highest share across major countries). However, a wide wealth gap is less concerning in a fast growing
country like India because the fast growth can create rising prosperity for all.
Looking in more detail at the eight key measures of power—India has the cheapest labor among major
countries. Adjusted for worker quality, labor is significantly cheaper than the global average.
We net this against its bad reading on innovation and technology and its weak relative position in educa-
tion. With innovation and technology—a small share (less than 1%) of global patent applications, a small share
(3%) of global R&D spending, and a moderate share (3%) of global researchers are in India. On years of edu-
cation, India is bad—students have on average 5.9 years of education versus 11.5 in the average major country.
PISA scores, which measure the proficiency of 15-year-old students across countries, are bad—336 versus 483
in the average major country.

COUNTRY POWER INDEX 2022
19
Note: With this page, I am calling out a few of the major gauges and a few of the stats within each gauge that reect
the broad trends we are seeing. e aggregate gauges and nal country power score I am showing include hundreds of
individual stats that we aggregate based on relevance, quality, and consistency across countries and time. To best capture
the overall strength of a country, I gave considerations to both quantity and quality, but structured things to best capture
who would win in a competition or war.
INDIA—KEY DRIVERS OF OUR COUNTRY POWER SCORE
Overall Empire Score (0–1) Level: 0.28 Rank: 7
The Big Cycles Level Z-Score Rank Trajectory
Economic/Financial Position Highly Favorable 1.1 2
Debt Burden Low Debt 0.5 6
Expected Growth 6.4% 1.1 1
Internal Order - - - -
Wealth/Opportunity/Values Gap Relatively Large -0.3 16
Internal Conflict - - - -
External Order At Risk - - -
Eight Key Measures of Power
Cost Competitiveness Very Strong 2.4 1
Economic Output Average 0.1 4
Military Strength Average 0.3 5
Trade Weak -0.8 12
Markets & Financial Center Weak -0.7 16
Education Weak -1.1 17
Reserve Currency Status Weak -0.7 19
Innovation & Technology Weak -1.1 19
Additional Measures of Power
Character/Determination/Civility Strong 1.3 3
Resource-Allocation Efficiency Average 0.3 8
Geology Average 0.3 9
Infrastructure & Investment Average -0.3 9
Governance/Rule of Law Weak -1.1 15
Acts of Nature Very Weak -2.4 24
-
Getting better Getting worse Flat
Note: All ranks shown are out of 24, except in the case of Internal Conict & Internal Order (out of 10) and Reserve
Status (out of 19).
THE CHANGING WORLD ORDER
20
THE POWERS AND PROSPECTS OF UNITED KINGDOM
is is our computer generated reading for United Kingdom as of January 2022.
Based on the latest readings of key indicators, United Kingdom appears to be a middle-of-the-pack power
(#8 among major countries today) on a flat trajectory. As shown in the table below, the key weaknesses of
United Kingdom are its unfavorable economic/financial position and its relative lack of natural resources.
e eight major measures of power are somewhat weak today but are, in aggregate, moving sideways.
e table below shows our aggregate country power gauge and the major drivers, as well as the rank of each
measure of power across 24 major countries today and the trajectory over the past twenty years.
To understand a country, we start by looking at the big cycles, as well as measures of power that both reflect
and drive the rise and fall of a country. While we refer to these factors individually, they are not separate; they
interact with and reinforce one another to move a country along its cycle.
For United Kingdom, the big cycles look somewhat unfavorable.
e UK is in an unfavorable position in its economic and financial cycles, with a high debt burden and rela-
tively low expected real growth over the next 10 years (1.2% per year). e UK has slightly more foreign debts
than foreign assets (net IIP is -24% of GDP). Non-financial debt levels are high (262% of GDP), and government
debt levels are high (109% of GDP). e bulk (93%) of these debts are in its own currency, which mitigates its debt
risks. e ability to use interest rate cuts to stimulate the economy is low (short rates at 0.4%), and the country is
already printing money to monetize debt.
Internal disorder is a moderate risk. Wealth, income, and values gaps are relatively large (relative to countries of
similar per capita income levels). Regarding Inequality—the top 1% and top 10% in United Kingdom capture 13%
and 36% of income (respectively the 18th and 17th highest share across major countries). Our internal conflict
gauge is average. is gauge measures actual conflict events (i.e., protests), political conflict (i.e., partisanship), and
general discontent (based on surveys).
On the eight key measures of power, United Kingdom looks somewhat weak in aggregate. It has no partic-
ularly prominent strengths or weaknesses that I will call out.
Note: With this page, I am calling out a few of the major gauges and a few of the stats within each gauge that reect
the broad trends we are seeing. e aggregate gauges and nal country power score I am showing include hundreds of
individual stats that we aggregate based on relevance, quality, and consistency across countries and time. To best capture
the overall strength of a country, I gave considerations to both quantity and quality, but structured things to best capture
who would win in a competition or war.

COUNTRY POWER INDEX 2022
21
UNITED KINGDOM—KEY DRIVERS OF OUR COUNTRY POWER SCORE
Overall Empire Score (0–1) Level: 0.27 Rank: 8
The Big Cycles Level Z-Score Rank Trajectory
Economic/Financial Position Unfavorable -1.5 24
Debt Burden High Debt -1.8 23
Expected Growth 1.2% -0.7 13
Internal Order Moderate Risk -0.3 8
Wealth/Opportunity/Values Gap Relatively Large -0.3 15
Internal Conflict Average -0.3 7
External Order At Risk 0.4 -
Eight Key Measures of Power
Reserve Currency Status Average -0.5 4
Markets & Financial Center Average 0.0 5
Trade Weak -0.5 6
Military Strength Average -0.2 7
Education Average -0.3 8
Innovation & Technology Average -0.3 8
Economic Output Weak -0.6 8
Cost Competitiveness Average -0.4 13
Additional Measures of Power
Governance/Rule of Law Strong 1.2 3
Resource-Allocation Efficiency Average -0.3 13
Character/Determination/Civility Average -0.3 15
Infrastructure & Investment Weak -0.7 16
Geology Weak -0.8 22
Acts of Nature Average 0.3 8
-
Getting better Getting worse Flat
Note: All ranks shown are out of 24, except in the case of Internal Conict & Internal Order (out of 10) and Reserve
Status (out of 19).
THE CHANGING WORLD ORDER
22
THE POWERS AND PROSPECTS OF FRANCE
is is our computer generated reading for France as of January 2022.
Based on the latest readings of key indicators, France appears to be a modest power (in the middle third of
countries we rank) on a flat trajectory. As shown in the table below, the key weaknesses of France are its un-
favorable economic/financial position, its people’s lower than average work ethic and low self-sufficiency,
and its relatively poor allocation of labor and capital. e eight major measures of power are somewhat weak
today but are, in aggregate, moving sideways.
e table below shows our aggregate country power gauge and the major drivers, as well as the rank of each
measure of power across 24 major countries today and the trajectory over the past twenty years.
To understand a country, we start by looking at the big cycles, as well as measures of power that both reflect
and drive the rise and fall of a country. While we refer to these factors individually, they are not separate; they
interact with and reinforce one another to move a country along its cycle.
For France, the big cycles look mixed.
France is in an unfavorable position in its economic and financial cycles, with a moderately high debt burden
and relatively low expected real growth over the next 10 years (0.5% per year). France has modestly more for-
eign debts than foreign assets (net IIP is -25% of GDP). Non-financial debt levels are high (269% of GDP), and
government debt levels are high (109% of GDP). France’s debts are largely in euros, which increases France’s
debt risks, since this is not a currency that France directly controls. e ability to use interest rate cuts to stim-
ulate the economy is low for the Eurozone (short rates are at -0.6%), and Europe is already printing money to
monetize debt.
Internal disorder is a low risk. Wealth, income, and values gaps are narrow (relative to countries of similar
per capita income levels). Regarding Inequality—the top 1% and top 10% in France capture 10% and 32% of
income (respectively the 22nd and 23rd highest share across major countries). Our internal conflict gauge is
average. is gauge measures actual conflict events (i.e., protests), political conflict (i.e., partisanship), and
general discontent (based on surveys).
On the eight key measures of power, France looks somewhat weak in aggregate. It has no particularly
prominent strengths or weaknesses that I will call out.
Note: With this page, I am calling out a few of the major gauges and a few of the stats within each gauge that reect
the broad trends we are seeing. e aggregate gauges and nal country power score I am showing include hundreds of
individual stats that we aggregate based on relevance, quality, and consistency across countries and time. To best capture
the overall strength of a country, I gave considerations to both quantity and quality, but structured things to best capture
who would win in a competition or war.

COUNTRY POWER INDEX 2022
23
FRANCE—KEY DRIVERS OF OUR COUNTRY POWER SCORE
Overall Empire Score (0–1) Level: 0.26 Rank: 9
The Big Cycles Level Z-Score Rank Trajectory
Economic/Financial Position Unfavorable -1.0 19
Debt Burden Moderately High Debt -0.8 19
Expected Growth 0.5% -0.9 18
Internal Order Low Risk 0.5 4
Wealth/Opportunity/Values Gap Narrow 1.1 1
Internal Conflict Average -0.1 6
External Order At Risk - - -
Eight Key Measures of Power
Military Strength Average -0.1 6
Markets & Financial Center Average -0.3 7
Trade Weak -0.5 7
Economic Output Weak -0.6 9
Innovation & Technology Average -0.5 10
Education Weak -0.5 11
Cost Competitiveness Weak -0.6 21
Reserve Currency Status - - - -
Additional Measures of Power
Infrastructure & Investment Average -0.2 8
Governance/Rule of Law Average 0.3 10
Geology Average -0.5 14
Resource-Allocation Efficiency Weak -1.6 22
Character/Determination/Civility Weak -1.5 23
Acts of Nature Average 0.0 10
-
Getting better Getting worse Flat
Note: All ranks shown are out of 24, except in the case of Internal Conict & Internal Order (out of 10) and Reserve
Status (out of 19).
THE CHANGING WORLD ORDER
24
THE POWERS AND PROSPECTS OF RUSSIA
is is our computer generated reading for Russia as of January 2022.
Based on the latest readings of key indicators, Russia appears to be a modest power (in the middle third
of countries we rank) on a flat trajectory. As shown in the table below, the key strengths of Russia are its
strong economic and financial position, its wealth of natural resources, and its strong military. Its weak-
nesses are its corruption and inconsistent rule of law, its poor infrastructure and low investment, and its
relative unimportance as a global financial center. e eight major measures of power are somewhat weak
today but are, in aggregate, moving sideways.
e table below shows our aggregate country power gauge and the major drivers, as well as the rank of each
measure of power across 24 major countries today and the trajectory over the past twenty years.
To understand a country, we start by looking at the big cycles, as well as measures of power that both reflect
and drive the rise and fall of a country. While we refer to these factors individually, they are not separate; they
interact with and reinforce one another to move a country along its cycle.
For Russia, the big cycles look mixed.
Russia is in a somewhat favorable position in its economic and financial cycles, with a low debt burden and
modest expected real growth over the next 10 years (2.6% per year). Russia has modestly more foreign assets than
foreign debts (net IIP is 33% of GDP). Non-financial debt levels are low (99% of GDP), and government debt
levels are low (15% of GDP). A significant share (24%) of Russia’s debt is denominated in foreign currencies,
which increases its debt risks.
Internal disorder is a moderate risk. Wealth, income, and values gaps are large (relative to countries of sim-
ilar per capita income levels). Regarding Inequality—the top 1% and top 10% in Russia capture 21% and 46%
of income (respectively the 4th and 10th highest share across major countries). Our internal conflict gauge is
high. is gauge measures actual conflict events (i.e., protests), political conflict (i.e., partisanship), and general
discontent (based on surveys).
External disorder is a risk. Most importantly, Russia and the United States, which is declining but remains
the #1 power (all things considered), are having significant conflict as measured by our external conflict gauge.
Looking in more detail at the eight key measures of power—Russia has a relatively strong military. A moderate
share (5%) of global military spending is by Russia, and it has a moderate share (8%) of the world’s military personnel.
We net this against its relative unimportance as a global financial center. Its equity markets are a small share
of the world total (less than 1% of total market cap and less than 1% of volume), and a small share of global
transactions happen in RUB (1%).

COUNTRY POWER INDEX 2022
25
Note: With this page, I am calling out a few of the major gauges and a few of the stats within each gauge that reect
the broad trends we are seeing. e aggregate gauges and nal country power score I am showing include hundreds of
individual stats that we aggregate based on relevance, quality, and consistency across countries and time. To best capture
the overall strength of a country, I gave considerations to both quantity and quality, but structured things to best capture
who would win in a competition or war.
RUSSIA—KEY DRIVERS OF OUR COUNTRY POWER SCORE
Overall Empire Score (0–1) Level: 0.26 Rank: 10
The Big Cycles Level Z-Score Rank Trajectory
Economic/Financial Position Somewhat Favorable 0.7 5 -
Debt Burden Low Debt 1.2 3
Expected Growth 2.6% -0.2 7 -
Internal Order Moderate Risk -1.2 9
Wealth/Opportunity/Values Gap Large -1.8 18
Internal Conflict High -0.5 9
External Order At Risk -2.1 -
Eight Key Measures of Power
Military Strength Strong 0.6 3
Cost Competitiveness Strong 0.7 7 -
Economic Output Average -0.5 7
Reserve Currency Status Weak -0.7 8 -
Education Average -0.5 9
Innovation & Technology Weak -0.7 14
Trade Weak -0.9 17
Markets & Financial Center Weak -1.0 17
Additional Measures of Power
Geology Very Strong 2.1 1
Resource-Allocation Efficiency Average -0.1 9 -
Character/Determination/Civility Average 0.2 10 -
Governance/Rule of Law Very Weak -1.9 20
Infrastructure & Investment Weak -1.0 21
Acts of Nature Average -0.1 11
-
Getting better Getting worse Flat
Note: All ranks shown are out of 24, except in the case of Internal Conict & Internal Order (out of 10) and Reserve
Status (out of 19).
THE CHANGING WORLD ORDER
26
THE POWERS AND PROSPECTS OF SINGAPORE
is is our computer generated reading for Singapore as of January 2022.
Based on the latest readings of key indicators, Singapore appears to be a modest power (in the middle third
of countries we rank) in gradual ascent. As shown in the table below, the key strengths of Singapore are its
strong economic and financial position, its people’s self-sufficiency and strong work ethic, its strong rule of
law/low corruption, and its effective allocation of labor and capital. Its weaknesses are its relatively weak
military and its relatively small economy. e eight major measures of power are somewhat weak today but
are, in aggregate, rising slowly.
e table below shows our aggregate country power gauge and the major drivers, as well as the rank of each
measure of power across 24 major countries today and the trajectory over the past twenty years.
To understand a country, we start by looking at the big cycles, as well as measures of power that both reflect
and drive the rise and fall of a country. While we refer to these factors individually, they are not separate; they
interact with and reinforce one another to move a country along its cycle.
For Singapore, the big cycles look somewhat favorable, though we have a limited read.
Singapore is in a highly favorable position in its economic and financial cycles, with a low debt burden but
relatively low expected real growth over the next 10 years (1.9% per year). Singapore has significantly more for-
eign assets than foreign debts (net IIP is 275% of GDP). Non-financial debt levels are high (319% of GDP), and
government debt levels are high (107% of GDP). A significant share (38%) of Singapore’s debt is denominated in
foreign currencies, which increases its debt risks. e ability to use interest rate cuts to stimulate the economy is
low (short rates at 0.4%).
At this time, we do not have a read on internal disorder for Singapore because we do not have an internal con-
flict gauge. Wealth, income, and values gaps are large (relative to countries of similar per capita income levels).
Regarding Inequality—the top 1% and top 10% in Singapore capture 14% and 46% of income (respectively the
13th and 9th highest share across major countries).
Looking in more detail at the eight key measures of power, we would call out its relatively weak military
and its relatively small economy. A small share (less than 1%) of global military spending is by Singapore, and
it has a small share (less than 1%) of the world’s military personnel.
Note: With this page, I am calling out a few of the major gauges and a few of the stats within each gauge that reect
the broad trends we are seeing. e aggregate gauges and nal country power score I am showing include hundreds of
individual stats that we aggregate based on relevance, quality, and consistency across countries and time. To best capture
the overall strength of a country, I gave considerations to both quantity and quality, but structured things to best capture
who would win in a competition or war.

COUNTRY POWER INDEX 2022
27
SINGAPORE—KEY DRIVERS OF OUR COUNTRY POWER SCORE
Overall Empire Score (0–1) Level: 0.22 Rank: 11
The Big Cycles Level Z-Score Rank Trajectory
Economic/Financial Position Highly Favorable 0.8 4
Debt Burden Low Debt 1.6 2
Expected Growth 1.9% -0.4 9
Internal Order - - - -
Wealth/Opportunity/Values Gap Large -2.1 22
Internal Conflict - - - -
External Order At Risk - - -
Eight Key Measures of Power
Markets & Financial Center Average -0.4 9
Cost Competitiveness Average 0.2 10
Reserve Currency Status Weak -0.7 10 -
Trade Weak -0.7 10
Innovation & Technology Weak -0.6 11
Education Weak -0.5 12
Military Strength Very Weak -2.1 23
Economic Output Weak -1.5 24
Additional Measures of Power
Character/Determination/Civility Very Strong 2.4 1
Governance/Rule of Law Very Strong 2.3 1
Infrastructure & Investment Average -0.2 7
Resource-Allocation Efficiency Very Strong 2.4 10
Geology Weak -0.6 17
Acts of Nature Average -0.3 15
-
Getting better Getting worse Flat
Note: All ranks shown are out of 24, except in the case of Internal Conict & Internal Order (out of 10) and Reserve
Status (out of 19).
THE CHANGING WORLD ORDER
28
THE POWERS AND PROSPECTS OF CANADA
is is our computer generated reading for Canada as of January 2022.
Based on the latest readings of key indicators, Canada appears to be a modest power (in the middle third
of countries we rank) on a flat trajectory. As shown in the table below, the key weaknesses of Canada that
put it in this position are its relatively weak military, its relatively small economy, and its relative unim-
portance to global trade. e eight major measures of power are somewhat weak today and are, in aggregate,
moving sideways.
e table below shows our aggregate country power gauge and the major drivers, as well as the rank of each
measure of power across 24 major countries today and the trajectory over the past twenty years.
To understand a country, we start by looking at the big cycles, as well as measures of power that both reflect
and drive the rise and fall of a country. While we refer to these factors individually, they are not separate; they
interact with and reinforce one another to move a country along its cycle.
For Canada, the big cycles look somewhat unfavorable, though we have a limited read.
Canada is in a moderately unfavorable position in its economic and financial cycles, with a moderately high
debt burden and relatively low expected real growth over the next 10 years (1.2% per year). Canada has significantly
more foreign assets than foreign debts (net IIP is 60% of GDP). Non-financial debt levels are high (281% of GDP),
and government debt levels are high (99% of GDP). e bulk (91%) of these debts are in its own currency, which
mitigates its debt risks. e ability to use interest rate cuts to stimulate the economy is low (short rates at 0.3%).
At this time, we do not have a read on internal disorder for Canada because we do not have an internal conflict
gauge. Wealth, income, and values gaps are relatively large (relative to countries of similar per capita income
levels). Regarding Inequality—the top 1% and top 10% in Canada capture 15% and 41% of income (respectively
the 11th and 15th highest share across major countries).
Looking in more detail at the eight key measures of power, we would call out its relatively weak military, its
relatively small economy, and its relative unimportance to global trade. A small share (1%) of global military
spending is by Canada, and it has a small share (less than 1%) of the world’s military personnel. Canada exports
just 3% of global exports.
Note: With this page, I am calling out a few of the major gauges and a few of the stats within each gauge that reect
the broad trends we are seeing. e aggregate gauges and nal country power score I am showing include hundreds of
individual stats that we aggregate based on relevance, quality, and consistency across countries and time. To best capture
the overall strength of a country, I gave considerations to both quantity and quality, but structured things to best capture
who would win in a competition or war.

COUNTRY POWER INDEX 2022
29
CANADA—KEY DRIVERS OF OUR COUNTRY POWER SCORE
Overall Empire Score (0–1) Level: 0.22 Rank: 12
The Big Cycles Level Z-Score Rank Trajectory
Economic/Financial Position Moderately Unfavorable -0.6 15
Debt Burden Moderately High Debt -0.3 14
Expected Growth 1.2% -0.7 14
Internal Order - - - -
Wealth/Opportunity/Values Gap Relatively Large -0.2 14
Internal Conflict - - - -
External Order At Risk - - -
Eight Key Measures of Power
Education Average -0.2 7
Reserve Currency Status Weak -0.6 7 -
Markets & Financial Center Average -0.4 10
Innovation & Technology Weak -0.6 13
Trade Weak -0.8 13
Cost Competitiveness Average -0.5 15
Economic Output Weak -1.1 17
Military Strength Weak -0.9 18
Additional Measures of Power
Geology Strong 0.7 5
Resource-Allocation Efficiency Strong 0.5 6
Governance/Rule of Law Strong 0.7 7
Character/Determination/Civility Average 0.1 11
Infrastructure & Investment Weak -0.7 18
Acts of Nature Strong 1.2 4 -
Getting better Getting worse Flat
Note: All ranks shown are out of 24, except in the case of Internal Conict & Internal Order (out of 10) and Reserve
Status (out of 19).
THE CHANGING WORLD ORDER
30
THE POWERS AND PROSPECTS OF AUSTRALIA
is is our computer generated reading for Australia as of January 2022.
Based on the latest readings of key indicators, Australia appears to be a modest power (in the middle third
of countries we rank) in gradual ascent. As shown in the table below, the key strength of Australia is its
wealth of natural resources. Its weaknesses are its relatively small economy, its relative unimportance to
global trade, and its relatively weak military. e eight major measures of power are somewhat weak today
but are, in aggregate, rising slowly.
e table below shows our aggregate country power gauge and the major drivers, as well as the rank of each
measure of power across 24 major countries today and the trajectory over the past twenty years.
To understand a country, we start by looking at the big cycles, as well as measures of power that both reflect
and drive the rise and fall of a country. While we refer to these factors individually, they are not separate; they
interact with and reinforce one another to move a country along its cycle.
For Australia, the big cycles look somewhat unfavorable, though we have a limited read.
Australia is in a moderately unfavorable position in its economic and financial cycles, with a moderately high
debt burden and relatively low expected real growth over the next 10 years (2.0% per year). Australia has modestly
more foreign debts than foreign assets (net IIP is -40% of GDP). Non-financial debt levels are typical for major
countries today (231% of GDP), and government debt levels are typical for major countries today (64% of GDP). e
bulk (95%) of these debts are in its own currency, which mitigates its debt risks. e ability to use interest rate cuts
to stimulate the economy is low (short rates at 0.1%), and the country is already printing money to monetize debt.
At this time, we do not have a read on internal disorder for Australia because we do not have an internal conflict
gauge. Wealth, income, and values gaps are typical (relative to countries of similar per capita income levels).
Regarding Inequality—the top 1% and top 10% in Australia capture 13% and 34% of income (respectively the
17th and 20th highest share across major countries).
Looking in more detail at the eight key measures of power, we would call out its relatively small economy,
its relative unimportance to global trade, and its relatively weak military. Australia exports just 2% of global
exports. A small share (2%) of global military spending is by Australia, and it has a small share (less than 1%)
of the world’s military personnel.
Note: With this page, I am calling out a few of the major gauges and a few of the stats within each gauge that reect
the broad trends we are seeing. e aggregate gauges and nal country power score I am showing include hundreds of
individual stats that we aggregate based on relevance, quality, and consistency across countries and time. To best capture
the overall strength of a country, I gave considerations to both quantity and quality, but structured things to best capture
who would win in a competition or war.

COUNTRY POWER INDEX 2022
31
AUSTRALIA—KEY DRIVERS OF OUR COUNTRY POWER SCORE
Overall Empire Score (0–1) Level: 0.22 Rank: 13
The Big Cycles Level Z-Score Rank Trajectory
Economic/Financial Position Moderately Unfavorable -0.6 16
Debt Burden Moderately High Debt -0.7 18
Expected Growth 2.0% -0.4 8
Internal Order - - -
Wealth/Opportunity/Values Gap Typical 0.3 7
Internal Conflict - - -
External Order At Risk - - -
Eight Key Measures of Power
Reserve Currency Status Weak -0.6 6 -
Education Average -0.5 10
Markets & Financial Center Average -0.4 11
Innovation & Technology Weak -0.6 12
Cost Competitiveness Weak -0.6 16
Military Strength Weak -0.9 17
Trade Weak -1.0 18
Economic Output Weak -1.3 21
Additional Measures of Power
Geology Very Strong 1.9 2
Governance/Rule of Law Strong 0.9 5
Character/Determination/Civility Average 0.1 12
Resource-Allocation Efficiency Average -0.4 14
Infrastructure & Investment Weak -0.7 17
Acts of Nature Strong 1.4 3
-
Getting better Getting worse Flat
Note: All ranks shown are out of 24, except in the case of Internal Conict & Internal Order (out of 10) and Reserve
Status (out of 19).
THE CHANGING WORLD ORDER
32
THE POWERS AND PROSPECTS OF SWITZERLAND
is is our computer generated reading for Switzerland as of January 2022.
Based on the latest readings of key indicators, Switzerland appears to be a modest power (in the middle third
of countries we rank) in gradual decline. As shown in the table below, the key strength of Switzerland is its
strong rule of law/low corruption. Its weaknesses are its relatively weak military, its relatively small econ-
omy, and its relative unimportance to global trade. e eight major measures of power are somewhat weak
today and are, in aggregate, falling slowly. In particular, Switzerland’s relative military strength, its importance
as a financial center, and its share of global output are declining.
e table below shows our aggregate country power gauge and the major drivers, as well as the rank of each
measure of power across 24 major countries today and the trajectory over the past twenty years.
To understand a country, we start by looking at the big cycles, as well as measures of power that both reflect
and drive the rise and fall of a country. While we refer to these factors individually, they are not separate; they
interact with and reinforce one another to move a country along its cycle.
For Switzerland, the big cycles look mixed.
Switzerland is in a moderately unfavorable position in its economic and financial cycles, with a low debt bur-
den but relatively low expected real growth over the next 10 years (1.2% per year). Switzerland has significantly
more foreign assets than foreign debts (net IIP is 103% of GDP). Non-financial debt levels are high (296% of
GDP), though government debt levels are low (28% of GDP). e bulk (84%) of these debts are in its own cur-
rency, which mitigates its debt risks. e ability to use interest rate cuts to stimulate the economy is very low (short
rates at -0.7%), and the country is already printing money to monetize debt.
At this time, we do not have a read on internal disorder for Switzerland because we do not have an internal conflict
gauge. Wealth, income, and values gaps are relatively large (relative to countries of similar per capita income lev-
els). Regarding Inequality—the top 1% and top 10% in Switzerland capture 11% and 32% of income (respectively
the 20th and 22nd highest share across major countries).
Looking in more detail at the eight key measures of power, we would call out its relatively weak military,
its relatively small economy, and its relative unimportance to global trade. A small share (less than 1%) of
global military spending is by Switzerland, and it has a small share (less than 1%) of the world’s military per-
sonnel. Switzerland exports just 2% of global exports.
Note: With this page, I am calling out a few of the major gauges and a few of the stats within each gauge that reect
the broad trends we are seeing. e aggregate gauges and nal country power score I am showing include hundreds of
individual stats that we aggregate based on relevance, quality, and consistency across countries and time. To best capture
the overall strength of a country, I gave considerations to both quantity and quality, but structured things to best capture
who would win in a competition or war.

COUNTRY POWER INDEX 2022
33
SWITZERLAND—KEY DRIVERS OF OUR COUNTRY POWER SCORE
Overall Empire Score (0–1) Level: 0.21 Rank: 14
The Big Cycles Level Z-Score Rank Trajectory
Economic/Financial Position Moderately Unfavorable -0.1 10 -
Debt Burden Low Debt 0.4 8
Expected Growth 1.2% -0.7 15 -
Internal Order - - - -
Wealth/Opportunity/Values Gap Relatively Large 0.0 13
Internal Conflict - - - -
External Order At Risk - - -
Eight Key Measures of Power
Innovation & Technology Average -0.2 7
Markets & Financial Center Average -0.3 8
Education Weak -0.7 13
Trade Weak -0.8 14
Reserve Currency Status Weak -0.7 17
Cost Competitiveness Weak -0.6 18
Military Strength Weak -1.2 19
Economic Output Weak -1.5 23
Additional Measures of Power
Governance/Rule of Law Strong 1.2 2
Infrastructure & Investment Average -0.1 5
Character/Determination/Civility Average 0.4 8
Resource-Allocation Efficiency Average -0.5 15
Geology Average -0.5 16
Acts of Nature Strong 1.2 5
-
Getting better Getting worse Flat
Note: All ranks shown are out of 24, except in the case of Internal Conict & Internal Order (out of 10) and Reserve
Status (out of 19).
THE CHANGING WORLD ORDER
34
THE POWERS AND PROSPECTS OF TURKEY
is is our computer generated reading for Turkey as of January 2022.
Based on the latest readings of key indicators, Turkey appears to be a modest power (in the middle third of
countries we rank) in gradual ascent. As shown in the table below, the key weaknesses of Turkey that put
it in this position are its weak relative position in education, its relative unimportance to global trade, and
its relative unimportance as a global financial center. e eight major measures of power are somewhat weak
today but are, in aggregate, rising slowly.
e table below shows our aggregate country power gauge and the major drivers, as well as the rank of each
measure of power across 24 major countries today and the trajectory over the past twenty years.
To understand a country, we start by looking at the big cycles, as well as measures of power that both reflect
and drive the rise and fall of a country. While we refer to these factors individually, they are not separate; they
interact with and reinforce one another to move a country along its cycle.
For Turkey, the big cycles look mixed.
Turkey is in a moderately unfavorable position in its economic and financial cycles, with a moderately high
debt burden and modest expected real growth over the next 10 years (3.9% per year). Turkey has modestly more
foreign debts than foreign assets (net IIP is -38% of GDP). Non-financial debt levels are low (102% of GDP),
and government debt levels are low (30% of GDP). A significant share (38%) of Turkey’s debt is denominated in
foreign currencies, which increases its debt risks.
At this time, we do not have a read on internal disorder for Turkey because we do not have an internal conflict
gauge. Wealth, income, and values gaps are large (relative to countries of similar per capita income levels). Re-
garding Inequality—the top 1% and top 10% in Turkey capture 19% and 55% of income (respectively the 7th
and 5th highest share across major countries).
Looking in more detail at the eight key measures of power, we would call out its weak relative position in
education, its relative unimportance to global trade, and its relative unimportance as a global financial
center. With education—Turkey has a small share of the world’s bachelor’s degrees (less than 1%). On years
of education, Turkey is poor—students have on average 8.2 years of education vs 11.5 in the average major
country. PISA scores, which measure the proficiency of 15-year-old students across countries, are around av-
erage—463 versus 483 in the average major country. Turkey exports just 1% of global exports. Turkey’s equity
markets are a small share of the world total (less than 1% of total market cap and less than 1% of volume), and
a small share of global transactions happen in TRY (less than 1%).
Note: With this page, I am calling out a few of the major gauges and a few of the stats within each gauge that reect
the broad trends we are seeing. e aggregate gauges and nal country power score I am showing include hundreds of
individual stats that we aggregate based on relevance, quality, and consistency across countries and time. To best capture
the overall strength of a country, I gave considerations to both quantity and quality, but structured things to best capture
who would win in a competition or war.

COUNTRY POWER INDEX 2022
35
TURKEY—KEY DRIVERS OF OUR COUNTRY POWER SCORE
Overall Empire Score (0–1) Level: 0.18 Rank: 15
The Big Cycles Level Z-Score Rank Trajectory
Economic/Financial Position Moderately Unfavorable -0.1 12
Debt Burden Moderately High Debt -0.5 15
Expected Growth 3.9% 0.2 4
Internal Order - - - -
Wealth/Opportunity/Values Gap Large -1.1 17
Internal Conflict - - - -
External Order At Risk - - -
Eight Key Measures of Power
Cost Competitiveness Strong 0.9 4
Economic Output Weak -0.7 11
Military Strength Weak -0.6 12
Innovation & Technology Weak -1.0 17
Reserve Currency Status Weak -0.7 18 -
Markets & Financial Center Weak -1.0 20
Trade Weak -1.2 20
Education Weak -1.7 21
Additional Measures of Power
Resource-Allocation Efficiency Average -0.2 11
Infrastructure & Investment Weak -0.5 12
Character/Determination/Civility Average 0.0 13
Governance/Rule of Law Weak -1.2 16
Geology Weak -0.6 18
Acts of Nature Average -0.1 13
-
Getting better Getting worse Flat
Note: All ranks shown are out of 24, except in the case of Internal Conict & Internal Order (out of 10) and Reserve
Status (out of 19).
THE CHANGING WORLD ORDER
36
THE POWERS AND PROSPECTS OF BRAZIL
is is our computer generated reading for Brazil as of January 2022.
Based on the latest readings of key indicators, Brazil appears to be a modest power (in the middle third of
countries we rank) in gradual ascent. As shown in the table below, the key strength of Brazil is its wealth
of natural resources. Its weaknesses are its weak relative position in education, its corruption and incon-
sistent rule of law, its relatively poor allocation of labor and capital, and its poor infrastructure and low
investment. e eight major measures of power are somewhat weak today but are, in aggregate, rising slowly.
e table below shows our aggregate country power gauge and the major drivers, as well as the rank of each
measure of power across 24 major countries today and the trajectory over the past twenty years.
To understand a country, we start by looking at the big cycles, as well as measures of power that both reflect
and drive the rise and fall of a country. While we refer to these factors individually, they are not separate; they
interact with and reinforce one another to move a country along its cycle.
For Brazil, the big cycles look somewhat unfavorable, though we have a limited read.
Brazil is in a moderately unfavorable position in its economic and financial cycles, with a moderately low debt
burden but relatively low expected real growth over the next 10 years (1.9% per year). Brazil has modestly more
foreign debts than foreign assets (net IIP is -35% of GDP). Non-financial debt levels are low (155% of GDP),
though government debt levels are typical for major countries today (87% of GDP). e bulk (91%) of these debts
are in its own currency, which mitigates its debt risks.
At this time, we do not have a read on internal disorder for Brazil because we do not have an internal conflict
gauge. Wealth, income, and values gaps are large (relative to countries of similar per capita income levels). Regard-
ing Inequality—the top 1% and top 10% in Brazil capture 26% and 59% of income (both the 2nd highest share
across major countries).
Looking in more detail at the eight key measures of power, we would call out its weak relative position in
education.
Note: With this page, I am calling out a few of the major gauges and a few of the stats within each gauge that reect
the broad trends we are seeing. e aggregate gauges and nal country power score I am showing include hundreds of
individual stats that we aggregate based on relevance, quality, and consistency across countries and time. To best capture
the overall strength of a country, I gave considerations to both quantity and quality, but structured things to best capture
who would win in a competition or war.

COUNTRY POWER INDEX 2022
37
BRAZIL—KEY DRIVERS OF OUR COUNTRY POWER SCORE
Overall Empire Score (0–1) Level: 0.18 Rank: 16
The Big Cycles Level Z-Score Rank Trajectory
Economic/Financial Position Moderately Unfavorable -0.4 13
Debt Burden Moderately Low Debt -0.2 13
Expected Growth 1.9% -0.4 11
Internal Order - - - -
Wealth/Opportunity/Values Gap Large -2.0 21
Internal Conflict - - - -
External Order At Risk - - -
Eight Key Measures of Power
Cost Competitiveness Strong 0.6 8
Military Strength Weak -0.5 10
Economic Output Weak -0.7 10
Reserve Currency Status Weak -0.7 14 -
Innovation & Technology Weak -1.0 18
Markets & Financial Center Weak -1.0 19
Trade Weak -1.1 19
Education Weak -1.4 20
Additional Measures of Power
Geology Strong 1.6 3
Character/Determination/Civility Weak -0.8 19
Resource-Allocation Efficiency Weak -1.3 20
Governance/Rule of Law Very Weak -2.3 21
Infrastructure & Investment Weak -1.1 22
Acts of Nature Very Weak -2.3 23
-
Getting better Getting worse Flat
Note: All ranks shown are out of 24, except in the case of Internal Conict & Internal Order (out of 10) and Reserve
Status (out of 19).
THE CHANGING WORLD ORDER
38
THE POWERS AND PROSPECTS OF ITALY
is is our computer generated reading for Italy as of January 2022.
Based on the latest readings of key indicators, Italy is not a meaningful global power (in the bottom third of
countries we rank) in gradual decline. As shown in the table below, the key weaknesses of Italy that put it in
this position are its unfavorable economic/financial position, its corruption and inconsistent rule of law, its
people’s lower than average work ethic and low self-sufficiency, and its relatively poor allocation of labor and
capital. e eight major measures of power are somewhat weak today and are, in aggregate, falling slowly. In par-
ticular, Italy’s importance to global trade, its share of global output, and its innovation and technology are declining.
e table below shows our aggregate country power gauge and the major drivers, as well as the rank of each
measure of power across 24 major countries today and the trajectory over the past twenty years.
To understand a country, we start by looking at the big cycles, as well as measures of power that both reflect
and drive the rise and fall of a country. While we refer to these factors individually, they are not separate; they
interact with and reinforce one another to move a country along its cycle.
For Italy, the big cycles look somewhat unfavorable, though we have a limited read.
Italy is in an unfavorable position in its economic and financial cycles, with a moderately high debt burden and
very low expected real growth over the next 10 years (-0.7% per year). Italy has similar levels of foreign debts and
foreign assets (net IIP is 4% of GDP). Non-financial debt levels are typical for major countries today (248% of
GDP), though government debt levels are high (138% of GDP). Italy’s debts are largely in euros, which increases
Italy’s debt risks, since this is not a currency that Italy directly controls. e ability to use interest rate cuts to
stimulate the economy is low for the Eurozone (short rates are at -0.6%), and Europe is already printing money
to monetize debt.
At this time, we do not have a read on internal disorder for Italy because we do not have an internal conflict
gauge. Wealth, income, and values gaps are narrow (relative to countries of similar per capita income levels).
Regarding Inequality—the top 1% and top 10% in Italy capture 9% and 33% of income (respectively the 23rd
and 21st highest share across major countries).
On the eight key measures of power, Italy looks somewhat weak in aggregate. It has no particularly prom-
inent strengths or weaknesses that I will call out.
Note: With this page, I am calling out a few of the major gauges and a few of the stats within each gauge that reect
the broad trends we are seeing. e aggregate gauges and nal country power score I am showing include hundreds of
individual stats that we aggregate based on relevance, quality, and consistency across countries and time. To best capture
the overall strength of a country, I gave considerations to both quantity and quality, but structured things to best capture
who would win in a competition or war.

COUNTRY POWER INDEX 2022
39
ITALY—KEY DRIVERS OF OUR COUNTRY POWER SCORE
Overall Empire Score (0–1) Level: 0.17 Rank: 17
The Big Cycles Level Z-Score Rank Trajectory
Economic/Financial Position Unfavorable -1.1 20
Debt Burden Moderately High Debt -0.6 16
Expected Growth -0.7% -1.3 23
Internal Order - - - -
Wealth/Opportunity/Values Gap Narrow 0.9 3
Internal Conflict - - - -
External Order At Risk - - -
Eight Key Measures of Power
Trade Weak -0.7 11
Economic Output Weak -0.7 12
Military Strength Weak -0.7 13
Markets & Financial Center Weak -0.7 14
Innovation & Technology Weak -0.8 15
Education Weak -0.9 16
Cost Competitiveness Weak -0.7 22
Reserve Currency Status - - - -
Additional Measures of Power
Infrastructure & Investment Weak -0.8 19
Governance/Rule of Law Very Weak -1.9 19
Geology Weak -0.7 20
Character/Determination/Civility Weak -1.4 22
Resource-Allocation Efficiency Very Weak -2.4 24
Acts of Nature Weak -0.9 17
-
Getting better Getting worse Flat
Note: All ranks shown are out of 24, except in the case of Internal Conict & Internal Order (out of 10) and Reserve
Status (out of 19).
THE CHANGING WORLD ORDER
40
THE POWERS AND PROSPECTS OF THE NETHERLANDS
is is our computer generated reading for e Netherlands as of January 2022.
Based on the latest readings of key indicators, the Netherlands is not a meaningful global power (in the
bottom third of countries we rank) on a flat trajectory. As shown in the table below, the key strength of the
Netherlands is its high internal order. Its weaknesses are its relatively weak military, its relatively small
economy, and its relatively expensive labor (on a quality-adjusted basis). e eight major measures of power
are somewhat weak today and are, in aggregate, moving sideways.
e table below shows our aggregate country power gauge and the major drivers, as well as the rank of each
measure of power across 24 major countries today and the trajectory over the past twenty years.
To understand a country, we start by looking at the big cycles, as well as measures of power that both reflect
and drive the rise and fall of a country. While we refer to these factors individually, they are not separate; they
interact with and reinforce one another to move a country along its cycle.
For the Netherlands, the big cycles look mixed.
e Netherlands is in a moderately unfavorable position in its economic and financial cycles, with a moder-
ately low debt burden but relatively low expected real growth over the next 10 years (0.7% per year). e Nether-
lands has significantly more foreign assets than foreign debts (net IIP is 91% of GDP). Non-financial debt levels
are high (275% of GDP), though government debt levels are typical for major countries today (51% of GDP). e
Netherlands’s debts are largely in euros, which increases the Netherlands’s debt risks, since this is not a currency
that the Netherlands directly controls. e ability to use interest rate cuts to stimulate the economy is low for the
Eurozone (short rates are at -0.6%), and Europe is already printing money to monetize debt.
Internal disorder is a low risk. Wealth, income, and values gaps are narrow (relative to countries of similar
per capita income levels). Regarding Inequality—the top 1% and top 10% in the Netherlands capture 7% and
30% of income (both the 24th highest share across major countries). Our internal conflict gauge is low. is
gauge measures actual conflict events (i.e., protests), political conflict (i.e., partisanship), and general discontent
(based on surveys).
Looking in more detail at the eight key measures of power, we would call out its relatively weak military,
its relatively small economy, and its relatively expensive labor (on a quality-adjusted basis). A small share
(less than 1%) of global military spending is by the Netherlands, and it has a small share (less than 1%) of the
world’s military personnel. A small share (2%) of global economic activity (adjusted for differences in prices
across countries) is in the Netherlands. With labor cost, once we adjust for worker quality, labor is somewhat
more expensive than the global average.

COUNTRY POWER INDEX 2022
41
Note: With this page, I am calling out a few of the major gauges and a few of the stats within each gauge that reect
the broad trends we are seeing. e aggregate gauges and nal country power score I am showing include hundreds of
individual stats that we aggregate based on relevance, quality, and consistency across countries and time. To best capture
the overall strength of a country, I gave considerations to both quantity and quality, but structured things to best capture
who would win in a competition or war.
THE NETHERLANDS—KEY DRIVERS OF OUR COUNTRY POWER SCORE
Overall Empire Score (0–1) Level: 0.16 Rank: 18
The Big Cycles Level Z-Score Rank Trajectory
Economic/Financial Position Moderately Unfavorable -0.5 14
Debt Burden Moderately Low Debt 0.0 12
Expected Growth 0.7% -0.9 17
Internal Order Low Risk 0.9 2
Wealth/Opportunity/Values Gap Narrow 0.6 5
Internal Conflict Low 1.3 1
External Order At Risk - - -
Eight Key Measures of Power
Trade Weak -0.6 8
Innovation & Technology Average -0.3 9
Markets & Financial Center Weak -0.5 12
Education Weak -0.7 14
Military Strength Very Weak -1.8 21
Economic Output Weak -1.4 22
Cost Competitiveness Weak -0.8 23
Reserve Currency Status - - - -
Additional Measures of Power
Governance/Rule of Law Strong 1.0 4
Resource-Allocation Efficiency Average 0.3 7
Infrastructure & Investment Average -0.4 11
Geology Average -0.4 13
Character/Determination/Civility Average -0.3 14
Acts of Nature Strong 0.5 7
-
Getting better Getting worse Flat
Note: All ranks shown are out of 24, except in the case of Internal Conict & Internal Order (out of 10) and Reserve
Status (out of 19).
THE CHANGING WORLD ORDER
42
THE POWERS AND PROSPECTS OF SPAIN
is is our computer generated reading for Spain as of January 2022.
Based on the latest readings of key indicators, Spain is not a meaningful global power (in the bottom third of
countries we rank) on a flat trajectory. As shown in the table below, the key weaknesses of Spain that put it
in this position are its unfavorable economic/financial position, its relatively poor allocation of labor and
capital, its people’s lower than average work ethic and low self-sufficiency, and its relatively small economy.
e eight major measures of power are somewhat weak today and are, in aggregate, moving sideways.
e table below shows our aggregate country power gauge and the major drivers, as well as the rank of each
measure of power across 24 major countries today and the trajectory over the past twenty years.
To understand a country, we start by looking at the big cycles, as well as measures of power that both reflect
and drive the rise and fall of a country. While we refer to these factors individually, they are not separate; they
interact with and reinforce one another to move a country along its cycle.
For Spain, the big cycles look somewhat unfavorable.
Spain is in an unfavorable position in its economic and financial cycles, with a high debt burden and very low
expected real growth over the next 10 years (0.1% per year). Spain has significantly more foreign debts than foreign
assets (net IIP is -74% of GDP). Non-financial debt levels are typical for major countries today (251% of GDP),
though government debt levels are high (116% of GDP). Spain’s debts are largely in euros, which increases Spain’s
debt risks, since this is not a currency that Spain directly controls. e ability to use interest rate cuts to stimulate the
economy is low for the Eurozone (short rates are at -0.6%), and Europe is already printing money to monetize debt.
Internal disorder is a moderate risk. Wealth, income, and values gaps are typical (relative to countries of simi-
lar per capita income levels). Regarding Inequality—the top 1% and top 10% in Spain capture 13% and 35% of
income (both the 19th highest share across major countries). Our internal conflict gauge is average. is gauge
measures actual conflict events (i.e., protests), political conflict (i.e., partisanship), and general discontent (based
on surveys).
Looking in more detail at the eight key measures of power, we would call out its relatively small economy.
A small share (2%) of global economic activity (adjusted for differences in prices across countries) is in Spain.
Note: With this page, I am calling out a few of the major gauges and a few of the stats within each gauge that reect
the broad trends we are seeing. e aggregate gauges and nal country power score I am showing include hundreds of
individual stats that we aggregate based on relevance, quality, and consistency across countries and time. To best capture
the overall strength of a country, I gave considerations to both quantity and quality, but structured things to best capture
who would win in a competition or war.

COUNTRY POWER INDEX 2022
43
SPAIN—KEY DRIVERS OF OUR COUNTRY POWER SCORE
Overall Empire Score (0–1) Level: 0.16 Rank: 19
The Big Cycles Level Z-Score Rank Trajectory
Economic/Financial Position Unfavorable -1.3 22
Debt Burden High Debt -1.1 22
Expected Growth 0.1% -1.1 21
Internal Order Moderate Risk 0.0 7
Wealth/Opportunity/Values Gap Typical 0.4 6
Internal Conflict Average -0.4 8
External Order At Risk - - -
Eight Key Measures of Power
Markets & Financial Center Weak -0.7 15
Education Weak -0.9 15
Military Strength Weak -0.9 16
Trade Weak -0.9 16
Innovation & Technology Weak -1.0 16
Economic Output Weak -1.0 16
Cost Competitiveness Weak -0.6 17
Reserve Currency Status - - - -
Additional Measures of Power
Infrastructure & Investment Weak -0.6 14
Governance/Rule of Law Weak -0.7 14
Geology Average -0.5 15
Character/Determination/Civility Weak -0.9 20
Resource-Allocation Efficiency Weak -1.5 21
Acts of Nature Weak -0.6 16
-
Getting better Getting worse Flat
Note: All ranks shown are out of 24, except in the case of Internal Conict & Internal Order (out of 10) and Reserve
Status (out of 19).
THE CHANGING WORLD ORDER
44
THE POWERS AND PROSPECTS OF INDONESIA
is is our computer generated reading for Indonesia as of January 2022.
Based on the latest readings of key indicators, Indonesia is not a meaningful global power (in the bottom third of
countries we rank), though in ascent. As shown in the table below, the key strengths of Indonesia are its strong
economic and financial position and its cost-competitive labor (on a quality-adjusted basis). Its weaknesses
are its weak relative position in education, its bad reading on innovation and technology, its corruption and
inconsistent rule of law, its relative unimportance as a global financial center, and its relative unimportance to
global trade. e eight major measures of power are somewhat weak today but are, in aggregate, rising. In particu-
lar, Indonesia’s competitiveness, its innovation and technology, and its relative position in education are increasing.
e table below shows our aggregate country power gauge and the major drivers, as well as the rank of each
measure of power across 24 major countries today and the trajectory over the past twenty years.
To understand a country, we start by looking at the big cycles, as well as measures of power that both reflect
and drive the rise and fall of a country. While we refer to these factors individually, they are not separate; they
interact with and reinforce one another to move a country along its cycle.
For Indonesia, the big cycles look somewhat favorable, though we have a limited read.
Indonesia is in a highly favorable position in its economic and financial cycles, with a low debt burden and
relatively high expected real growth over the next 10 years (5.9% per year). Indonesia has slightly more foreign
debts than foreign assets (net IIP is -24% of GDP). Non-financial debt levels are very low (63% of GDP), and
government debt levels are low (29% of GDP). A significant share (21%) of Indonesia’s debt is denominated in
foreign currencies, which increases its debt risks.
At this time, we do not have a read on internal disorder for Indonesia because we do not have an internal
conflict gauge. Wealth, income, and values gaps are relatively large (relative to countries of similar per capita
income levels). Regarding Inequality—the top 1% and top 10% in Indonesia capture 18% and 47% of income
(respectively the 9th and 7th highest share across major countries).
Looking in more detail at the eight key measures of power—Indonesia has the second cheapest labor
among major countries. Adjusted for worker quality, labor is significantly cheaper than the global average.
We net this against its weak relative position in education, its bad reading on innovation and technology,
and its relative unimportance as a global financial center, among other weaknesses laid out in the table.
With education—Indonesia has a small share of the world’s bachelor’s degrees (2%). On years of education,
Indonesia is poor—students have on average 8.0 years of education versus 11.5 in the average major country.
PISA scores, which measure the proficiency of 15-year-old students across countries, are bad—382 versus 483
in the average major country. With innovation and technology—a small share (less than 1%) of global patent
applications, a small share (less than 1%) of global R&D spending, and a small share (less than 1%) of global
researchers are in Indonesia. Indonesia’s equity markets are a small share of the world total (less than 1% of total
market cap and less than 1% of volume), and a small share of global transactions happen in IDR (less than 1%).

COUNTRY POWER INDEX 2022
45
Note: With this page, I am calling out a few of the major gauges and a few of the stats within each gauge that reect
the broad trends we are seeing. e aggregate gauges and nal country power score I am showing include hundreds of
individual stats that we aggregate based on relevance, quality, and consistency across countries and time. To best capture
the overall strength of a country, I gave considerations to both quantity and quality, but structured things to best capture
who would win in a competition or war.
INDONESIA—KEY DRIVERS OF OUR COUNTRY POWER SCORE
Overall Empire Score (0–1) Level: 0.15 Rank: 20
The Big Cycles Level Z-Score Rank Trajectory
Economic/Financial Position Highly Favorable 1 3
Debt Burden Low Debt 0.6 5
Expected Growth 5.9% 0.9 2
Internal Order - - - -
Wealth/Opportunity/Values Gap Relatively Large 0.1 10
Internal Conflict - - - -
External Order At Risk - - -
Eight Key Measures of Power
Cost Competitiveness Very Strong 2.0 2
Reserve Currency Status Weak -0.7 9 -
Economic Output Weak -0.8 14
Military Strength Weak -0.8 15
Innovation & Technology Weak -1.2 20
Trade Weak -1.2 22
Markets & Financial Center Weak -1.1 23
Education Very Weak -1.9 24
Additional Measures of Power
Character/Determination/Civility Strong 1.3 4
Resource-Allocation Efficiency Strong 1.0 4
Geology Average 0.4 7
Infrastructure & Investment Weak -0.6 13
Governance/Rule of Law Weak -1.3 17
Acts of Nature Very Weak -2.1 22
-
Getting better Getting worse Flat
Note: All ranks shown are out of 24, except in the case of Internal Conict & Internal Order (out of 10) and Reserve
Status (out of 19).
THE CHANGING WORLD ORDER
46
THE POWERS AND PROSPECTS OF SAUDI ARABIA
is is our computer generated reading for Saudi Arabia as of January 2022.
Based on the latest readings of key indicators, Saudi Arabia is not a meaningful global power (in the bottom
third of countries we rank) on a flat trajectory. As shown in the table below, the key strength of Saudi Arabia
is its strong economic and financial position. Its weaknesses are its weak relative position in education, its
bad reading on innovation and technology, its relative unimportance as a global financial center, and its
relative unimportance to global trade. e eight major measures of power are somewhat weak today but are, in
aggregate, moving sideways.
e table below shows our aggregate country power gauge and the major drivers, as well as the rank of each
measure of power across 24 major countries today and the trajectory over the past twenty years.
To understand a country, we start by looking at the big cycles, as well as measures of power that both reflect
and drive the rise and fall of a country. While we refer to these factors individually, they are not separate; they
interact with and reinforce one another to move a country along its cycle.
For Saudi Arabia, the big cycles look somewhat favorable, though we have a limited read.
Saudi Arabia is in a highly favorable position in its economic and financial cycles, with a low debt burden.
Saudi Arabia has significantly more foreign assets than foreign debts (net IIP is 76% of GDP). Non-financial debt
levels are low (97% of GDP), and government debt levels are low (32% of GDP). e bulk (86%) of these debts
are in its own currency, which mitigates its debt risks.
At this time, we do not have a read on internal disorder for Saudi Arabia because we do not have an internal
conflict gauge. Wealth, income, and values gaps are large (relative to countries of similar per capita income levels).
Regarding Inequality—the top 1% and top 10% in Saudi Arabia capture 21% and 54% of income (respectively the
5th and 6th highest share across major countries).
Looking in more detail at the eight key measures of power, we would call out its weak relative position in
education, its bad reading on innovation and technology, and its relative unimportance as a global finan-
cial center, among other weaknesses laid out in the table. With education—Saudi Arabia has a small share of
the world’s bachelor’s degrees (less than 1%). On years of education, Saudi Arabia is around average—students
have on average 9.6 years of education versus 11.5 in the average major country. With innovation and technol-
ogy—a small share (less than 1%) of global patent applications, a small share (less than 1%) of global R&D
spending, and a small share (less than 1%) of global researchers are in Saudi Arabia. Saudi Arabia’s equity
markets are a small share of the world total (less than 1% of total market cap and less than 1% of volume), and
a small share of global transactions happen in SAR (less than 1%).

COUNTRY POWER INDEX 2022
47
Note: With this page, I am calling out a few of the major gauges and a few of the stats within each gauge that reect the
broad trends we are seeing. We exclude a number of gauges for Saudi Arabia due to missing data. e aggregate gauges
and nal country power score I am showing include hundreds of individual stats that we aggregate based on relevance,
quality, and consistency across countries and time. To best capture the overall strength of a country, I gave considerations
to both quantity and quality, but structured things to best capture who would win in a competition or war.
SAUDI ARABIA—KEY DRIVERS OF OUR COUNTRY POWER SCORE
Overall Empire Score (0–1) Level: 0.14 Rank: 21
The Big Cycles Level Z-Score Rank Trajectory
Economic/Financial Position Highly Favorable 1.9 1 -
Debt Burden Low Debt 1.9 1 -
Expected Growth - - - -
Internal Order - - - -
Wealth/Opportunity/Values Gap Large -3.0 24
Internal Conflict - - - -
External Order At Risk - - -
Eight Key Measures of Power
Military Strength Weak -0.6 11
Reserve Currency Status Weak -0.7 12 -
Economic Output Weak -1.2 18
Education Weak -1.4 19
Trade Weak -1.2 21
Markets & Financial Center Weak -1.1 22
Innovation & Technology Weak -1.4 24
Cost Competitiveness - - - -
Additional Measures of Power
Geology Average 0.3 8
Infrastructure & Investment Weak -0.6 15
Resource-Allocation Efficiency Weak -0.7 23
Governance/Rule of Law - - - -
Character/Determination/Civility - - - -
Acts of Nature Very Weak -1.9 19
-
Getting better Getting worse Flat
Note: All ranks shown are out of 24, except in the case of Internal Conict & Internal Order (out of 10) and Reserve
Status (out of 19).
THE CHANGING WORLD ORDER
48
THE POWERS AND PROSPECTS OF MEXICO
is is our computer generated reading for Mexico as of January 2022.
Based on the latest readings of key indicators, Mexico is not a meaningful global power (in the bottom third
of countries we rank) on a flat trajectory. As shown in the table below, the key weaknesses of Mexico that
put it in this position are its weak relative position in education, its bad reading on innovation and technol-
ogy, its relatively weak military, and its corruption and inconsistent rule of law. e eight major measures of
power are somewhat weak today but are, in aggregate, moving sideways.
e table below shows our aggregate country power gauge and the major drivers, as well as the rank of each
measure of power across 24 major countries today and the trajectory over the past twenty years.
To understand a country, we start by looking at the big cycles, as well as measures of power that both reflect
and drive the rise and fall of a country. While we refer to these factors individually, they are not separate; they
interact with and reinforce one another to move a country along its cycle.
For Mexico, the big cycles look somewhat favorable, though we have a limited read.
Mexico is in a somewhat favorable position in its economic and financial cycles, with a low debt burden and
modest expected real growth over the next 10 years (3.4% per year). Mexico has modestly more foreign debts than
foreign assets (net IIP is -44% of GDP). Non-financial debt levels are low (87% of GDP), and government debt
levels are low (37% of GDP). A significant share (23%) of Mexico’s debt is denominated in foreign currencies,
which increases its debt risks.
At this time, we do not have a read on internal disorder for Mexico because we do not have an internal conflict
gauge. Wealth, income, and values gaps are large (relative to countries of similar per capita income levels). Regard-
ing Inequality—the top 1% and top 10% in Mexico capture 27% and 57% of income (respectively the 1st and 3rd
highest share across major countries).
Looking in more detail at the eight key measures of power, we would call out its weak relative position in edu-
cation, its bad reading on innovation and technology, and its relatively weak military. With education—Mex-
ico has a moderate share of the world’s bachelor’s degrees (4%). On years of education, Mexico is poor—students
have on average 9.1 years of education versus 11.5 in the average major country. PISA scores, which measure the
proficiency of 15-year-old students across countries, are poor—416 versus 483 in the average major country. With
innovation and technology—a small share (less than 1%) of global patent applications, a small share (less than 1%)
of global R&D spending, and a small share (less than 1%) of global researchers are in Mexico. A small share (less
than 1%) of global military spending is by Mexico, and it has a small share (2%) of the world’s military personnel.
Note: With this page, I am calling out a few of the major gauges and a few of the stats within each gauge that reect
the broad trends we are seeing. e aggregate gauges and nal country power score I am showing include hundreds of
individual stats that we aggregate based on relevance, quality, and consistency across countries and time. To best capture
the overall strength of a country, I gave considerations to both quantity and quality, but structured things to best capture
who would win in a competition or war.

COUNTRY POWER INDEX 2022
49
MEXICO—KEY DRIVERS OF OUR COUNTRY POWER SCORE
Overall Empire Score (0–1) Level: 0.13 Rank: 22
The Big Cycles Level Z-Score Rank Trajectory
Economic/Financial Position Somewhat Favorable 0.3 6
Debt Burden Low Debt 0.3 9
Expected Growth 3.4% 0.1 5
Internal Order - - - -
Wealth/Opportunity/Values Gap Large -1.8 20
Internal Conflict - - - -
External Order At Risk - - -
Eight Key Measures of Power
Cost Competitiveness Strong 0.8 5
Economic Output Weak -0.8 13
Trade Weak -0.9 15
Reserve Currency Status Weak -0.7 16 -
Markets & Financial Center Weak -1.0 18
Education Weak -1.3 18
Military Strength Very Weak -2.1 22 -
Innovation & Technology Weak -1.3 23
Additional Measures of Power
Character/Determination/Civility Strong 1.3 5
Geology Average -0.3 12
Resource-Allocation Efficiency Average -0.3 12
Infrastructure & Investment Weak -1.0 20
Governance/Rule of Law Very Weak -2.3 23
Acts of Nature Weak -1.1 18
-
Getting better Getting worse Flat
Note: All ranks shown are out of 24, except in the case of Internal Conict & Internal Order (out of 10) and Reserve
Status (out of 19).
THE CHANGING WORLD ORDER
50
THE POWERS AND PROSPECTS OF SOUTH AFRICA
is is our computer generated reading for South Africa as of January 2022.
Based on the latest readings of key indicators, South Africa is not a meaningful global power (in the bottom
third of countries we rank) on a flat trajectory. As shown in the table below, the key weaknesses of South
Africa that put it in this position are its weak relative position in education, its bad reading on innova-
tion and technology, its relatively weak military, its relatively small economy, its relative unimportance to
global trade, its corruption and inconsistent rule of law, and its poor infrastructure and low investment.
e eight major measures of power are somewhat weak today and are, in aggregate, moving sideways.
e table below shows our aggregate country power gauge and the major drivers, as well as the rank of each
measure of power across 24 major countries today and the trajectory over the past twenty years.
To understand a country, we start by looking at the big cycles, as well as measures of power that both reflect
and drive the rise and fall of a country. While we refer to these factors individually, they are not separate; they
interact with and reinforce one another to move a country along its cycle.
For South Africa, the big cycles look mixed.
South Africa is in a somewhat favorable position in its economic and financial cycles, with a moderately low
debt burden and modest expected real growth over the next 10 years (3.3% per year). South Africa has modestly
more foreign assets than foreign debts (net IIP is 26% of GDP). Non-financial debt levels are low (142% of GDP),
though government debt levels are typical for major countries today (59% of GDP). e bulk (87%) of these debts
are in its own currency, which mitigates its debt risks.
At this time, we do not have a read on internal disorder for South Africa because we do not have an internal
conflict gauge. Wealth, income, and values gaps are large (relative to countries of similar per capita income
levels). Regarding Inequality—the top 1% and top 10% in South Africa capture 20% and 66% of income (re-
spectively the 6th and highest share across major countries).
Looking in more detail at the eight key measures of power, we would call out its weak relative position in
education, its bad reading on innovation and technology, and its relatively weak military, among other
weaknesses laid out in the table. With education—South Africa has a small share of the world’s bachelor’s
degrees (less than 1%). On years of education, South Africa is poor—students have on average 7.9 years of
education versus 11.5 in the average major country. With innovation and technology—a small share (less than
1%) of global patent applications, a small share (less than 1%) of global R&D spending, and a small share (less
than 1%) of global researchers are in South Africa. A small share (less than 1%) of global military spending is
by South Africa, and it has a small share (less than 1%) of the world’s military personnel.

COUNTRY POWER INDEX 2022
51
Note: With this page, I am calling out a few of the major gauges and a few of the stats within each gauge that reect
the broad trends we are seeing. e aggregate gauges and nal country power score I am showing include hundreds of
individual stats that we aggregate based on relevance, quality, and consistency across countries and time. To best capture
the overall strength of a country, I gave considerations to both quantity and quality, but structured things to best capture
who would win in a competition or war.
SOUTH AFRICA—KEY DRIVERS OF OUR COUNTRY POWER SCORE
Overall Empire Score (0–1) Level: 0.09 Rank: 23
The Big Cycles Level Z-Score Rank Trajectory
Economic/Financial Position Somewhat Favorable 0.2 8
Debt Burden Moderately Low Debt 0.3 10
Expected Growth 3.2% 0.0 6
Internal Order - - - -
Wealth/Opportunity/Values Gap Large -2.8 23
Internal Conflict - - - -
External Order At Risk - - -
Eight Key Measures of Power
Cost Competitiveness Strong 0.8 6
Reserve Currency Status Weak -0.7 11 -
Economic Output Weak -1.2 20
Military Strength Weak -1.3 20
Markets & Financial Center Weak -1.0 21
Innovation & Technology Weak -1.2 22
Trade Weak -1.3 23
Education Very Weak -1.8 23
Additional Measures of Power
Geology Average -0.2 10
Character/Determination/Civility Weak -0.5 17 -
Resource-Allocation Efficiency Weak -0.6 17
Governance/Rule of Law Weak -1.5 18
Infrastructure & Investment Weak -1.1 23
Acts of Nature Very Weak -2.0 20
-
Getting better Getting worse Flat
Note: All ranks shown are out of 24, except in the case of Internal Conict & Internal Order (out of 10) and Reserve
Status (out of 19).
THE CHANGING WORLD ORDER
52
THE POWERS AND PROSPECTS OF ARGENTINA
is is our computer generated reading for Argentina as of January 2022.
Based on the latest readings of key indicators, Argentina is not a meaningful global power (in the bottom
third of countries we rank) in gradual decline. As shown in the table below, the key weaknesses of Argen-
tina that put it in this position are its unfavorable economic/financial position, its relative unimportance
as a global financial center, its weak relative position in education, its bad reading on innovation and tech-
nology, its relatively weak military, its relatively small economy, its relative unimportance to global trade,
its corruption and inconsistent rule of law, its poor infrastructure and low investment, and its relatively
poor allocation of labor and capital. e eight major measures of power are somewhat weak today and are, in
aggregate, falling slowly.
e table below shows our aggregate country power gauge and the major drivers, as well as the rank of each
measure of power across 24 major countries today and the trajectory over the past twenty years.
To understand a country, we start by looking at the big cycles, as well as measures of power that both reflect
and drive the rise and fall of a country. While we refer to these factors individually, they are not separate; they
interact with and reinforce one another to move a country along its cycle.
For Argentina, the big cycles look somewhat unfavorable, though we have a limited read.
Argentina is in an unfavorable position in its economic and financial cycles, with a high debt burden and rela-
tively low expected real growth over the next 10 years (1.2% per year). Argentina has modestly more foreign assets
than foreign debts (net IIP is 42% of GDP). Non-financial debt levels are low (91% of GDP), though government
debt levels are typical for major countries today (73% of GDP). A significant share (29%) of Argentina’s debt is
denominated in foreign currencies, which increases its debt risks.
At this time, we do not have a read on internal disorder for Argentina because we do not have an internal conflict
gauge. Wealth, income, and values gaps are relatively large (relative to countries of similar per capita income lev-
els). Regarding Inequality—the top 1% and top 10% in Argentina capture 16% and 41% of income (respectively
the 10th and 14th highest share across major countries).
Looking in more detail at the eight key measures of power, we would call out its relative unimportance
as a global financial center, its weak relative position in education, and its bad reading on innovation and
technology, among other weaknesses laid out in the table. Argentina’s equity markets are a small share of the
world total (less than 1% of total market cap and less than 1% of volume), and a small share of global transac-
tions happen in ARS (less than 1%). With education—Argentina has a small share of the world’s bachelor’s de-
grees (less than 1%). On years of education, Argentina is poor—students have on average 9.1 years of education
versus 11.5 in the average major country. PISA scores, which measure the proficiency of 15-year-old students
across countries, are poor—422 versus 483 in the average major country. With innovation and technology—a
small share (less than 1%) of global patent applications, a small share (less than 1%) of global R&D spending,
and a small share (less than 1%) of global researchers are in Argentina.

COUNTRY POWER INDEX 2022
53
Note: With this page, I am calling out a few of the major gauges and a few of the stats within each gauge that reect
the broad trends we are seeing. e aggregate gauges and nal country power score I am showing include hundreds of
individual stats that we aggregate based on relevance, quality, and consistency across countries and time. To best capture
the overall strength of a country, I gave considerations to both quantity and quality, but structured things to best capture
who would win in a competition or war.
ARGENTINA—KEY DRIVERS OF OUR COUNTRY POWER SCORE
Overall Empire Score (0–1) Level: 0.05 Rank: 24
The Big Cycles Level Z-Score Rank Trajectory
Economic/Financial Position Unfavorable -1.0 18
Debt Burden High Debt -1.0 21
Expected Growth 1.2% -0.7 16
Internal Order - - - -
Wealth/Opportunity/Values Gap Relatively Large 0.1 11
Internal Conflict - - - -
External Order At Risk - - -
Eight Key Measures of Power
Cost Competitiveness Average 0.4 9
Reserve Currency Status Weak -0.7 13 -
Economic Output Weak -1.2 19
Innovation & Technology Weak -1.2 21
Education Weak -1.7 22
Markets & Financial Center Weak -1.3 24
Trade Weak -1.3 24
Education Very Weak -2.1 24
Additional Measures of Power
Geology Average -0.3 11
Character/Determination/Civility Weak -0.7 18
Resource-Allocation Efficiency Very Weak -2.4 19
Governance/Rule of Law Very Weak -2.3 22
Infrastructure & Investment Weak -1.5 24
Acts of Nature Very Weak -2.0 21
-
Getting better Getting worse Flat
Note: All ranks shown are out of 24, except in the case of Internal Conict & Internal Order (out of 10) and Reserve
Status (out of 19).
THE CHANGING WORLD ORDER
54
MORE DETAIL ON EACH OF THE GAUGES
■
Education: is gauge measures basic and higher education, split about evenly between the two. Half
of the measure captures the absolute quantity of educated people at various levels and about half is
placed on quality such as higher education rankings, test scores, and average years of education. e
US ranks highest in this gauge (driven by strong absolute and relative measures of higher education),
with China close behind (due to its large number of educated people).
■
Innovation & Technology: is gauge measures inventiveness, technological advancement, and entre-
preneurship. It gives about half its weight to the country’s absolute share of key innovation metrics (e.g.,
patents, researchers, R&D spending, and venture capital funding) and half to a combination of exter-
nal rankings and measures of innovation per capita (to help capture how widespread innovation is in
the economy). e US is at the top of this measure due to its strength across a variety of metrics, while
China ranks second due to its large share of global research spending, researchers, and patents. China
is rising quickly in this area.
■
Cost Competitiveness: is gauge measures what one gets for what one pays. We want to see this be-
cause countries that produce the best at costs that are too expensive aren’t in good shape, even though
they rank high in quality. We look at quality-adjusted and productivity-adjusted labor costs, along
with other productivity measures. Major developing economies (particularly India) rank highest in this
gauge, while the US ranks around the middle of the pack and European countries rank lowest (due to
high labor costs).
■
Infrastructure & Investment: is gauge measures the quantity of infrastructure and investment spend-
ing and the quality of it. It captures a country’s absolute share of global investment, as well as the extent to
which a country prioritizes quality of infrastructure and productivity-enhancing investments. e gauge
weighs measures of investment as a share of world investment, overall infrastructure quality, investment
and savings as a share of GDP, and logistics performance. China is currently the strongest according to
this gauge (having risen sharply over the past 20 years) because of its high rates of productive investment
relative to both the world and the size of its own past investment; the US is second, due largely to its high
share of global productive investment, though it is worsening.
■
Economic Output: is gauge measures the strength of a country’s economic resources. We measure out-
put primarily through GDP levels as a share of world total (adjusted for price differences across countries).
We allocate some weight to GDP per capita rather than total GDP to capture quality. China ranks first in
this gauge, insignificantly ahead of the US but also rising fastest, due its large PPP-adjusted GDP share.
Europe ranks third.
■
Expected Growth (Big Economic Cycle): is gauge measures how well a country is positioned to
grow its economy over the next 10 years. We look at a variety of metrics to estimate forward-looking
10-year economic growth, placing two-thirds weight on metrics that predict productivity and one-third
on metrics that predict the impact of indebtedness on growth. Currently India is predicted to grow the
fastest, followed by China, with the US predicted to grow a bit slower than average, and with Japan
and a number of European countries predicted to grow least.
■
Trade: is gauge measures how strong of an exporter a country is. It looks at the absolute level of a
country’s exports as a share of the world. China scores highest (being the largest exporter in the world),
followed by Europe and the US.
COUNTRY POWER INDEX 2022
55
■
Military Strength: is gauge is driven mostly by the absolute share of military spending and strength
measured by the number of personnel, the number of nuclear weapons, and external indices of military
capabilities. It does not look at military powers in varying regions or of various types, failing to capture
some military superiorities Russia and China have in certain geographic areas, certain types of military
technologies, or the role of alliances. e US is still the strongest overall military power based on these
measures, with a strong lead in spending and a nuclear weapons program that is only rivaled by Russia.
China is now ranked second and is rising quickly.
■
Financial Center: is gauge measures the level of development and sizes of a country’s financial
markets and financial center. We look at absolute measures of transaction shares and market capitaliza-
tions, as well as external indices of financial center cities. e US remains the top-ranked power in this
metric by a significant margin (driven primarily by its very large share of world equity and debt mar-
kets), with China and Europe ranking second and third, respectively.
■
Reserve Currency Status: is gauge measures the extent to which a country’s currency operates as
a global reserve currency. We measure reserve currency status by the share of transactions, debts, and
central bank reserves that are denominated or held in a country’s currency. Similar to financial center
status, the US remains the top-ranked power in this metric by a significant margin, with Europe and
Japan ranking second and third, respectively.
■
Debt Burden (Big Economic Cycle): is gauge is based on a combination of a) debt levels relative
to asset levels, b) the sizes of external and internal surpluses and deficits, c) the sizes of debt service
costs relative to GDP, d) the amount of debt in a country’s own currency versus foreign currency, e)
the amount of debt held by its own citizens versus foreigners, and f) its credit rating. We composed it
this way because it has proven itself to be the most reliable way we have of foreshadowing declines in
the value of real wealth, whether they come in the form of debt defaults that result from not creating
enough money and credit to satisfy excessive debt needs or devaluations that come from creating more
than enough money and credit to satisfy excessive debt needs. I constructed this index to exclude re-
serve currency status so that I could see the exposure a country would have if it lost its reserve currency
status.
■
Internal Conflict (Internal Order): is gauge looks at how much domestic conflict and discontent
there is. It measures actual conflict events (e.g., protests), political conflict (e.g., partisanship), and
general discontent (based on surveys). e US ranks highest in this gauge among the major countries,
driven by measures of partisanship and higher incidence of internal conflict events, and it has been ris-
ing fast.
■
Governance/Rule of Law: is gauge measures the extent to which a country’s legal system is consis-
tent, predictable, and conducive to growth and advancement. It combines rule of law measures (based
primarily on business surveys of doing business in the country) and corruption measures (via a combi-
nation of external corruption indices and surveys of businesses). Russia and India score lowest (worst)
on the gauge, while the UK, the Netherlands, and Japan score highest (best), with Germany and the
US close behind.
■
Geology: is gauge measures each country’s geographic endowment, including land size and the
value of its natural resources. It includes the total production of energy, agriculture, and industrial met-
als in order to capture the absolute production capacity of each nation, as well as net exports to capture
relative self-reliance for each of the categories (in addition to measuring some other natural resources
like freshwater supply). Russia and the US score highest (followed by China, which relies more on the
rest of the world to cover its natural resource needs), while Japan and the UK score lowest.
THE CHANGING WORLD ORDER
56
■
Gaps in Wealth, Opportunity & Values: is gauge measures how big the gaps in wealth/income,
opportunities, and values are. It combines measures of both a) wealth and income inequality (e.g., how
much does the top 1 percent have versus the rest) and b) political conflict (e.g., how split is the legisla-
ture on ideology). India, the US, and China score worst because of very large wealth and income gaps
(and in the case of the US also significant political gaps). At the other end of the spectrum are the Eu-
ropean nations and Japan, which generally speaking have lower income and wealth inequality.
■
Character/Civility/Determination: is gauge attempts to measure to what extent the attitudes of
each country’s people create an environment that’s supportive to civility and hard work, which supports
growth and advancement. It uses a) surveys around attitudes toward working hard and success and b)
other measures that proxy how much a society values self-sufficiency and work (e.g., government trans-
fer payments size, effective retirement age) to quantify this. China and India score highest (the US is
third), and the European countries (notably Spain and France) score lowest.
■
Resource-Allocation Efficiency: is gauge attempts to measure how efficiently each country is using
its labor and capital. It looks at whether the country has chronically high unemployment (i.e., not find-
ing efficient ways to employ its people), if debt growth generates commensurate income growth over
time, and external indices and surveys about the rigidity of the labor market and ease of getting loans.
Much of Europe (particularly France and Spain) score lowest on these measures, while the US and Ger-
many score near the top. Developing countries (particularly Russia, but also China and India) also score
fairly well in this measure—as generally speaking they produce more income growth per unit of debt
growth.
■
Acts of Nature: is gauge measures how vulnerable to and impacted by acts of nature each country
is. While it is difficult to quantify all the various acts of nature that might affect a country, we used ex-
pert assessments of future climate change impact on each country’s GDP, external assessments of each
country’s preparedness for natural disasters, and the outcomes from the COVID pandemic (as that
was a real-time test against an act of nature). I consider this rating so-so and find that there is still a lot
more we want to capture to make this gauge better, hence its low quality.
■
External Conflict: While not a part of the model for individual countries, the external conflict gauge
measures the levels of economic, political/cultural, and military conflict between pairs of major coun-
tries. Within each category, we tried to come up with a mix of structural indicators (to establish a
baseline level of conflict between countries) and timely indicators (to flag major escalations above that
baseline). For example, for economic conflict we track bilateral trade between countries, tariff rates, and
timely news around sanctions, trade wars, etc.

COUNTRY POWER INDEX 2022
57
APPENDIX: CONSIDERING QUALITY VERSUS QUANTITY AND THE SIZE OF COUNTRIES
Each determinant is an aggregate of many indicators that I combined in the way that I felt best captured that
particular determinant, giving consideration to both measures of absolute size (like share of global exports) and
measures that adjust for/remove size (like GDP per capita or PISA test scores). Some determinants use a mix of
both types of measures, and some are all one type. I tried to structure these weightings so that I could imagine
who would win if countries had a competition like the Olympics or a war. However, in doing this exercise, I
found it helpful to see how countries would score if I just looked at things on a per capita/quality basis, which
would allow me to differentiate between countries that are extremely developed and capable, but small (like
Singapore) versus countries that get a lot of credit for being big (like India).
e scores shown in the table below are the weighted average percent rank from 0% (scoring worst on all un-
derlying measures) to 100% (scoring best on all underlying measures) of all the underlying indicators that make
up the determinant, shown if we include all the measures (“Total”) or only per capita/quality measures. In case
it is helpful or interesting to you, you can review those scores below.
3
4
3
In a few cases where there were no quality measures, I had to create quality measures by adjusting the quantity for a country’s population, turning
it into a per capita measure. We did not give reserve currency status scores to the countries that share the euro, which is why those measures are
displayed as dashes.
4
Because the notion of competitiveness is inherently relative, we only show the total score for this measure.
