
1
© 2023 All Rights Reserved Garitano Advisors S.L.U.
Independent Media & Data Advisors
COSMETICS
INDUSTRY REPORT

2
© 2023 All Rights Reserved Garitano Advisors S.L.U.
Who are we
INDARU is an independent consulting firm
specialized in media and data analysis

3
© 2023 All Rights Reserved Garitano Advisors S.L.U.
Our mission
We exist to help brands extract all the value
from their media investments

4
© 2023 All Rights Reserved Garitano Advisors S.L.U.
We provide services around media consulting, media audits and data
& analytics with the final goal of optimizing advertisers ROI
Marketing
technology
selection and
data strategy
CONSULTANCY
Evaluate
your media
performance
MEDIA AUDITS
Track media
buying
results in
real-time
DASHBOARDING
MARKETING
MIX MODELING
Measure and
find the most
efficient media
mix

5
© 2023 All Rights Reserved Garitano Advisors S.L.U.
Indaru brings unfettered and fast advice from years of experience in
data analytics and media
Independent Advice Owner-Operated Data & Media Experts
Not tied to any media agency,
technology vendors or
advertisers
No red-tape of a corporate firm,
enabling us to be agile and
responsive
Experts in data analytics makeup
half the team while the other half
are experts in media

6
© 2023 All Rights Reserved Garitano Advisors S.L.U.
6 - 7
Executive Summary
8-9
Recommendations
11-27
Market Overview
28-43
Influence of Social Media
44-58
Organic Trends
59-71
Consumers: Gen Z
72-86
Consumers: Millennials
87-95
Consumers: Gen X
96-117
Advertising
Table of Contents
7
© 2023 All Rights Reserved Garitano Advisors S.L.U.
Executive Summary
Cosmetics follow the global trend of online
advertisement, with US and France increasing their
investment in digital ad spend of 1,216 million USD
(US) and 85 million USD(France). (S34)
Youtube (61%) and Facebook (51%) were the most
trusted social networks to find and buy products in
the US in 2022. (S35)
Leading goals of social media marketers are
engagement (62%) and reach (60%), but there is a big
opportunity for monetization.
(S41)
The revenue growth of natural cosmetics
worldwide is rapidly growing, with an average
growth of 6.94%. From a negative growth rate of
2.90% in 2015, it has been increasing ever since and
is expected to keep on growing for the years to
come. (S45)
Gen Z is the generation that purchased most on
social media, especially within the age range of
18 to 24 with 55.50%. (S69)

8
© 2023 All Rights Reserved Garitano Advisors S.L.U.
Executive Summary
Internet searches (46%) and television (42%) were
Millennials’ favorite channels for care product ideas
in the US in 2021.
(S83)
The digital shoppers from Gen X barely use social
media for shopping. 17% used Facebook (17%) in the
US & 9% Instagram. (S94)
The main medium for ads for beauty and personal
luxury was TV (44.6%) followed closely by digital
(36%). (S97)
The digital ad spending in Western Europe in 2021
was largely dominated by display (38b USD) and
search (35b USD). (S113)

9
© 2023 All Rights Reserved Garitano Advisors S.L.U.
Recommendations
R1: Personal care and beauty are the second most purchased product categories on social media based on data from the US in 2021 (S37). This highlights
the shift from offline to online purchasing. Therefore, there is a need for companies to adapt to consumers’ need purchasing habits and expectations to
remain competitive in the market. Cosmetics companies must develop their online platforms (ie: user-friendly website) to facilitate the consumer journey of
consumers. For example, Gen Z were the generation to be most influenced by social media, with 63% of them buying an item after seeing it on said platform
(S64).
R2: Having said that, it is recommended for companies to develop a strong online presence. In 2022, Dior, L’Oréal and Lacôme were the most influential
brands globally (S40), and when looking at the leading brands in the market they are part of the top brands, with L’Oréal being the leading brand (S27). For
that reason, it is important for companies to not only have a user friendly interface where consumers can easily purchase products, but also work on their
online presence using social media. This must be tailored based on your target audience and objectives. It will be important to establish the main goals of the
social media account, being leads, followers, likes, comments or others, in order to establish the right marketing strategy.
R3: The way that shoppers approach skincare is undergoing a fundamental change, as they are becoming more informed and educated about the products
on offer. With the increasing awareness of ingredients and their potentially harmful effects, consumer knowledge now sets the rhythm that beauty
companies have to follow. For example, 50% of Gen Z said they would not buy from skin care products from brands that are not justified as cruelty-free in
2021 in the US (S54). Clearly, there is a huge opportunity in the natural & organic cosmetics sector, with an average global growth rate of 6.94% (S46), and
thus it could be a good opportunity to enter this growing segment within the cosmetics industry.
R4: To remain competitive, it is crucial to be able to predict which trends will arise in the future, and thus adapt one’s’ marketing strategy. Some key trends
to have in mind in the next few years are social media as a medium of advertising, which is said to bring the highest ROI in 2026, and online audio-podcast
as they are expected to take larger share of consumers’ media time though they are under-invested (S109). Great opportunities.

10
© 2023 All Rights Reserved Garitano Advisors S.L.U.
Recommendations
R4: Millennials are reshaping the beauty and personal care industry at a rapid pace. It is a target group with high importance, and therefore it is
important to know how to target them using the marketing mix modelling. In order to target them properly, one must know through which channels are
Millennials most likely to be receptive and active on. Millennials’ favorite channels for care product ideas were internet searches and television in 2021
in US (S83). On top of that, they were most influenced by Facebook (30%) as a social network, and Instagram being the runner up (23%) in 2022 in US.
Consequently, Millennials are best targeted through internet searches, television, and in terms of social network with Facebook. Interestingly,
Millennials have the most exposure to content on TikTok in 2023 - which is good to keep in mind (S85).
R5: When looking for care product ideas, Gen Z were most interested in social media channels and internet searches (S68). It is a useful information, as
89% of
Gen Z were more willing to try new brands online as of 2021 in US (S63). This is important in order to develop an efficient marketing mix model
to target Gen Z, and for cosmetics, it seems that the best online channels are social media and internet searches.
R6: Though Millennials are the largest demographic group in the US, Gen X are the one with the highest and most willing to spend their expendable
income
(S88). This is important in order to see which group will be interested by a company’s product, being whether it is luxurious (higher prices) or
non-luxurious (lower-prices). Additionally, knowing which price range is good, but it must be accompanied with a marketing strategy and thus see
which channels are Gen X most receptive on. In this case, the best channel to reach Gen X is through emails (S92), an important information when
developing the marketing mix modelling for this target group.

11
© 2023 All Rights Reserved Garitano Advisors S.L.U.
MARKET OVERVIEW

12
© 2023 All Rights Reserved Garitano Advisors S.L.U.
Executive Summary
The cosmetic market revenue worldwide in
2022 was concentrated mainly in United States
with 18,010 million USD and China, with
13,970 million USD. The runner ups were
Japan, India, and United Kingdom. (S21)
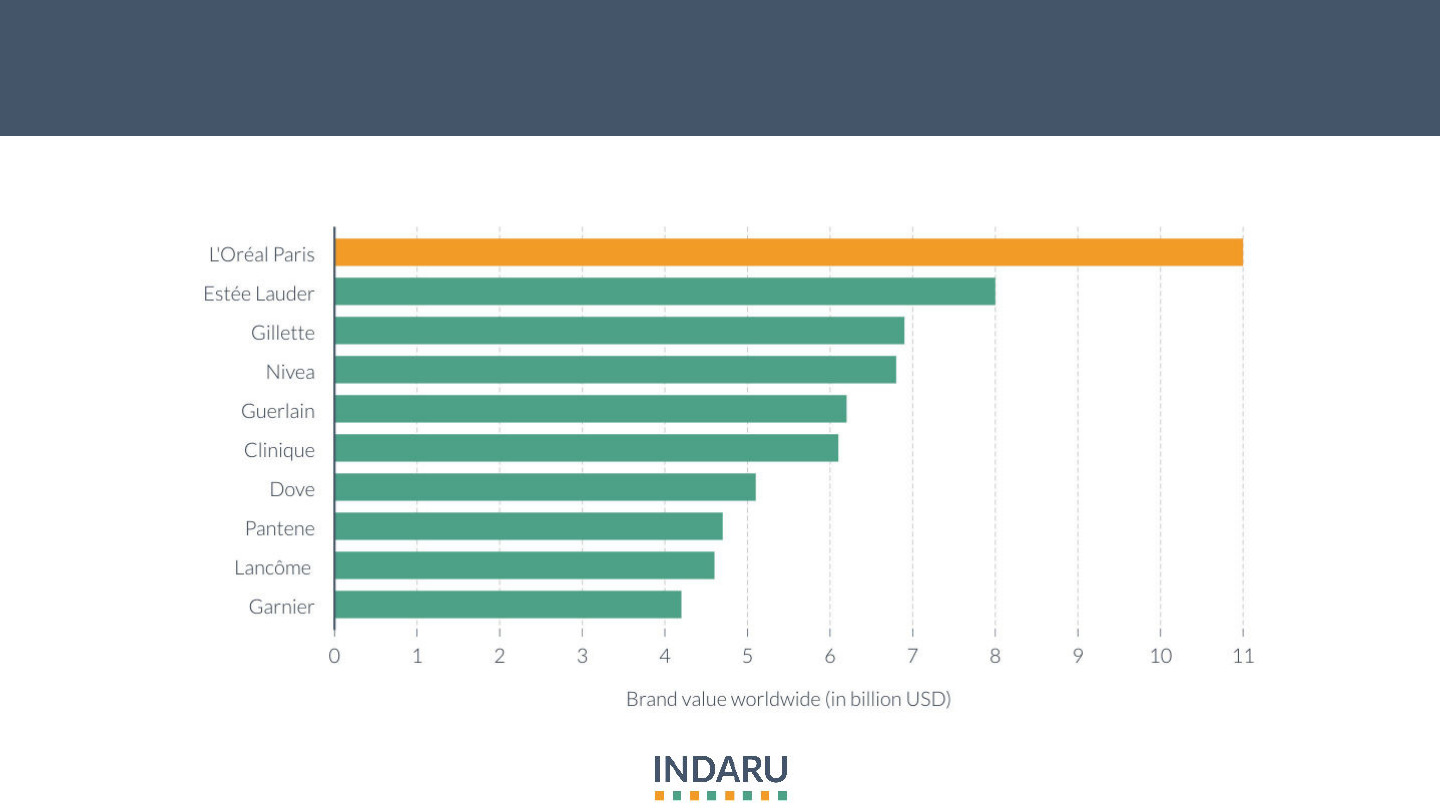
L’Oréal Paris was the leading brand if cosmetic
worldwide, with a brand value of 11.22 billion
US$, followed by Estée Lauder with 7.93 billion
US$.
(S27)
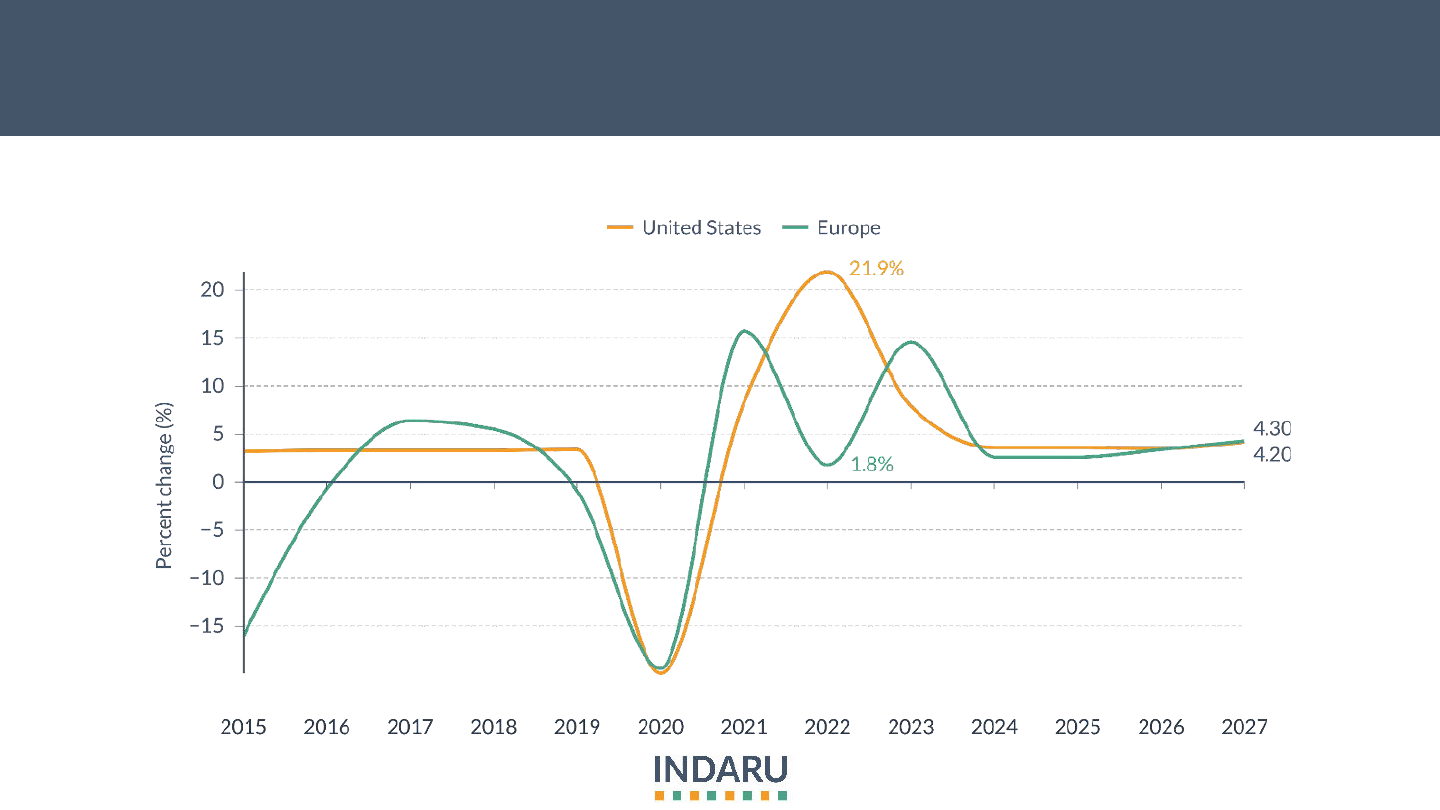
The revenue of cosmetics in the United States in 2022
had a rapid growth rate of 21.9%, while Europe grew by
1.8%, though as the years go by, both of their growth rate
are aligning at the same pace, with 3.5% and 3.4% of
growth in 2026. (S15)
The revenue of the luxury cosmetics market worldwide
is expected to increase up to 31.56 billion US$ by 2027.
(S19)
Meanwhile, the difference between luxury and
non-luxury cosmetics between United States and Europe
is that in the US 70% of the revenue come from
non-luxury, while in Europe the split is more equal with
54% of revenue coming from non-luxury.
(S20)

13
© 2023 All Rights Reserved Garitano Advisors S.L.U.
Cosmetics & personal care made up 26%, the second biggest
segment, of sale from direct selling in EU in 2018
Source: Tighe, D. “Europe: Sales Share of Direct Selling Industry by Product 2018.” Statista, 15 Mar. 2021,
Distribution of sales from direct selling in Europe 2018

14
© 2023 All Rights Reserved Garitano Advisors S.L.U.
Global cosmetics market is expected to reach 131,041 USD in
revenue by 2026, and to grow annually by 4.25% (CAGR 5yr)
Source: Published by Statista Research Department, & 27, S. (2022, September 27). Global: Cosmetics market
revenue 2013-2026. Statista.
Revenue of the global cosmetics markets
15
© 2023 All Rights Reserved Garitano Advisors S.L.U.
In 2022, US (21.9%) grew at a much faster pace than Europe (1.8%),
though in 2026 onwards the growth rates seem to coincide (3.5%/3.4%)
Source: Beauty & Personal Care - Global: Statista market forecast. Statista. (n.d.).
Revenue change of cosmetics in the US and EU

16
© 2023 All Rights Reserved Garitano Advisors S.L.U.
The category “Lips” had tremendous growth, 50.3% in 2022, but natural
cosmetics is gaining popularity, with expected grow of 10% in 2023
Source: Cosmetics - united states: Statista market forecast. Statista. (n.d.).
Revenue change per categories worldwide
17
© 2023 All Rights Reserved Garitano Advisors S.L.U.
The segments “Eyes” and “Face” are the most remunerative, with each
making above 20,000 million USD of revenue worldwide
Source: Published by Statista Research Department, & 27, S. (2022, September 27). Global: Cosmetics market
revenue 2013-2026. Statista.
Revenue of the global cosmetics market 2021, by segment
(in million USD)
Eyes
Face
Natural cosmetics
Lips
Nails

18
© 2023 All Rights Reserved Garitano Advisors S.L.U.
US has a higher consumer spending (per capita) than Europe,
however, Europe’s CAGR 5yr is higher (3.4%) than US’ (2.4%)
Source: Beauty & Personal Care - Global: Statista market forecast. Statista. (n.d.).
Consumer spending (per capita) in the US and EU

19
© 2023 All Rights Reserved Garitano Advisors S.L.U.
Additionally, the revenue of the luxury cosmetics market worldwide is
expected to increase up to 31.56 billion USD by 2027
Source: Published by Statista Research Department, & 26, S. (2022, September 26). Global: Luxury cosmetics
market revenue 2014-2027. Statista.
Luxury cosmetics market revenue worldwide
Luxury cosmetics market revenue worldwide

20
© 2023 All Rights Reserved Garitano Advisors S.L.U.
United States is more focused on non-luxury (70%), while Europe has
a more balanced focused with 46% luxury and 54% non-luxury
Source: Beauty & Personal Care - Global: Statista market forecast. Statista. (n.d.).
Luxury & non luxury cosmetics splits in
terms of revenue for the US in 2022
Luxury & non luxury cosmetics splits in
terms of revenue for the EU in 2022

21
© 2023 All Rights Reserved Garitano Advisors S.L.U.
United States and China concentrated most of the cosmetic revenue in
2022, with over 18K and 13K millions of USD respectively
Source: Cosmetics - worldwide: Statista market forecast. Statista. (n.d.).
Cosmetics market revenue worldwide 2022 by country (in million USD)

22
© 2023 All Rights Reserved Garitano Advisors S.L.U.
Online conversion rate of e-commerce sites were highest for health &
beauty, and hair care with over 3% conversion rate
Source: Chevalier, S. (2022, December 8). Global conversion rate by industry 2022. Statista.
Global conversion rate is selected verticals in 3rd quarter 2022

23
© 2023 All Rights Reserved Garitano Advisors S.L.U.
Though cosmetics are still mainly bought offline (69.9%), online
revenue is increasing, with a 11.2% growth between 2017 and 2023
Source: Published by Statista Research Department, & 26, S. (2022, September 26). Global: Luxury cosmetics
market revenue 2014-2027. Statista.
Offline and online revenue share worldwide

24
© 2023 All Rights Reserved Garitano Advisors S.L.U.
More specifically to US and EU, there are similarities in terms of the
proportion of online (33%/27%) and offline (67%/73%)
Source: Beauty & Personal Care - US: Statista market forecast. Statista. (n.d.).
Online & offline cosmetics revenue
share in 2022 in the United States
Online & offline cosmetics revenue
share in 2022 in the Europe
Online & offline cosmetics revenue
share in 2022 in the US
Online & offline cosmetics revenue
share in 2022 in the EU

25
© 2023 All Rights Reserved Garitano Advisors S.L.U.
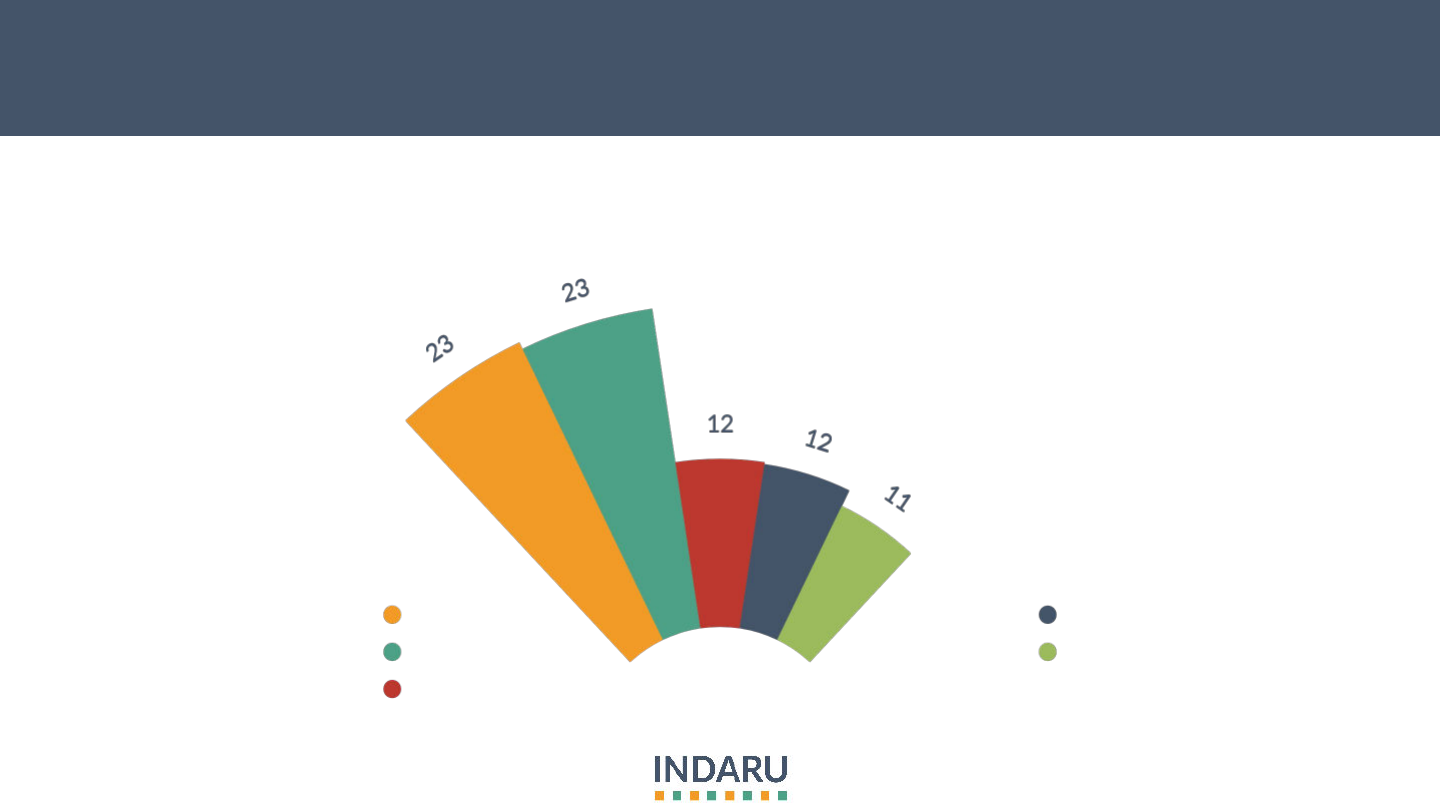
Online shopping is quite diversified among channels, though the most
popular in 2020 was “other online store” (19%) in the US
Source: Beauty & Personal Care - US: Statista market forecast. Statista. (n.d.).
Expenditure proportion by online channels for cosmetics in the US in 2020
26
© 2023 All Rights Reserved Garitano Advisors S.L.U.
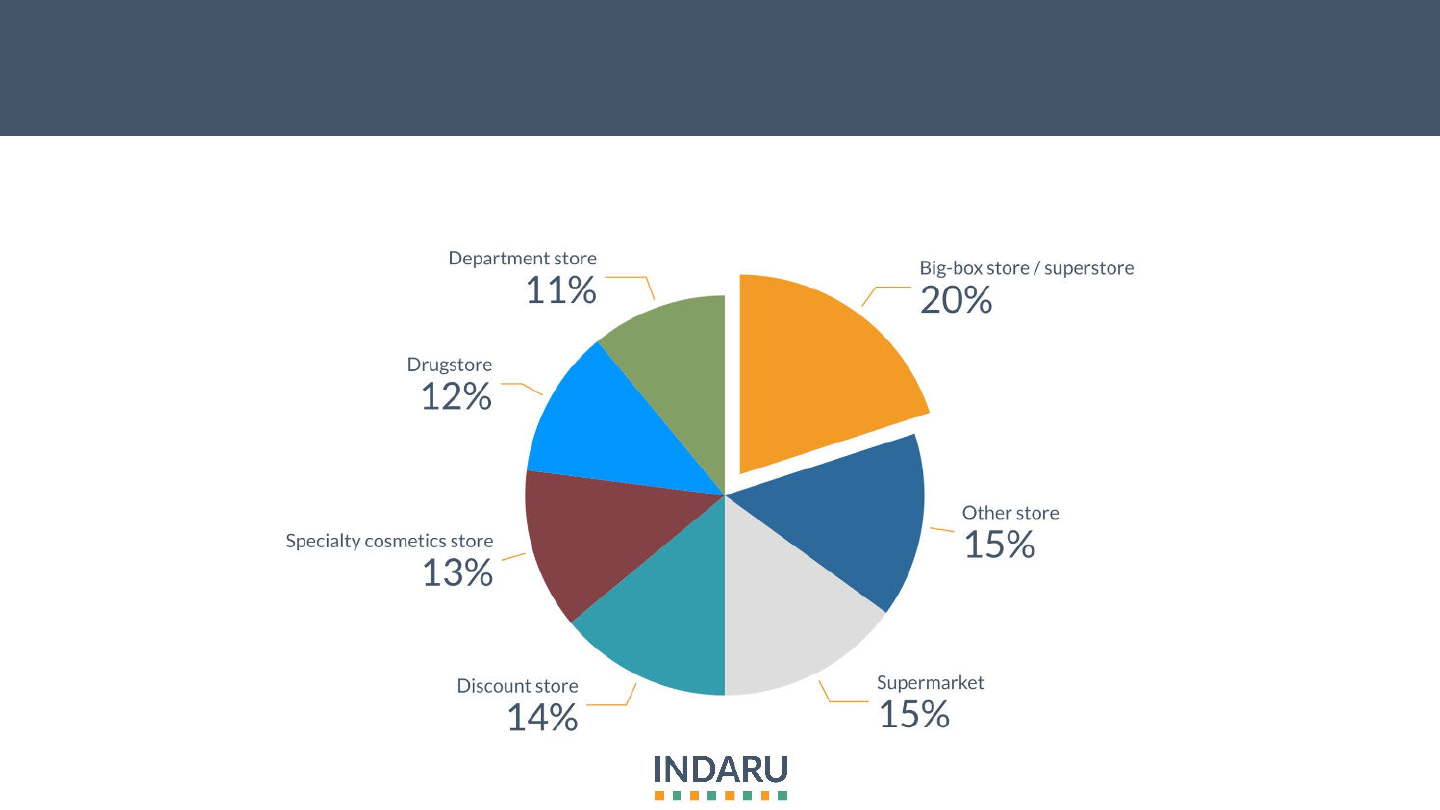
Offline channels are fairly fragmented, with big box store (20%) being
the main one among others in the US in 2020
Source: Beauty & Personal Care - US: Statista market forecast. Statista. (n.d.).
Expenditure proportion by offline channels for cosmetics in the US in 2020
27
© 2023 All Rights Reserved Garitano Advisors S.L.U.
L’Oréal Paris was the leading brand of cosmetic worldwide, with a
brand value of 11.22 billion USD, followed by Estée Lauder in 2022
Source: Petruzzi, D. (2022, May 10). Brand value of the leading 10 cosmetic brands worldwide 2022. Statista.
Brand value of leading 10 cosmetics brands worldwide in 2022

28
© 2023 All Rights Reserved Garitano Advisors S.L.U.
INFLUENCE OF
SOCIAL MEDIA

29
© 2023 All Rights Reserved Garitano Advisors S.L.U.
Executive Summary
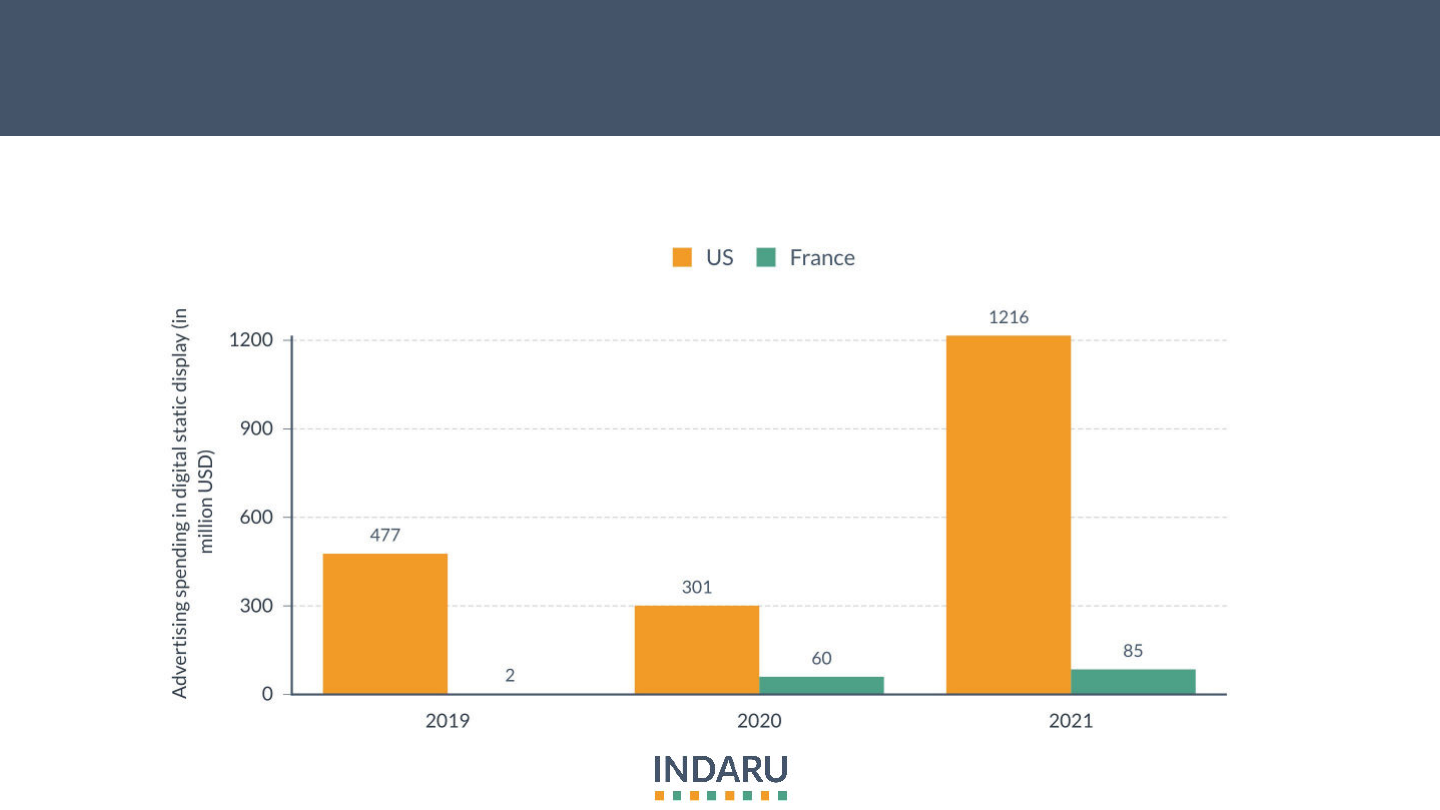
Cosmetics follow the global trend of online
advertisement, with United States and France
increasing their investment in digital ad spend of
1,216 million US$ (US) and 85 million US$ (France),
compared to 477 million US$ (US) and 2 million US$
(France) in 2019. (S34)
Youtube (61%) and Facebook (51%) were the most
trusted social networks to find and buy products
in the US in 2022. (S35)
The second product category most purchased on on
social media in 2021 in the US was “Personal care &
beauty” with 15%. (S37)
Dior, L’Oréal Paris and Lancôme were the most
influential beauty brands globally in the first half of
2022, with a MIV above 337. (S40)
Leading goals of social media marketers are
engagement (62%) and reach (60%), but there is a big
opportunity for monetization.
(S41)

30
© 2023 All Rights Reserved Garitano Advisors S.L.U.
In 2022, the number of US social buyers was expected to be
102.60millions, and is expected to grow by 11.4% in 2025
Source: Chevalier, S. (2022, October 11). U.S. Social Buyers 2020-2025. Statista.
Number of US social buyers

31
© 2023 All Rights Reserved Garitano Advisors S.L.U.
Global sales through social media platforms are estimated to reach
992b USD in 2022, and forecasted to reach 3 trillion USD in 2026
Source: Chevalier, S. (2022, September 16). Global Social Commerce Market Size 2022-2026. Statista.
Social commerce sales value worldwide

32
© 2023 All Rights Reserved Garitano Advisors S.L.U.
Internet advertising spending grows at a 13.27% rate CAGR in North
America, compared to CAGR in Western Europe of 9.38%
Source: Published by Statista Research Department, & 10, J. (2023, January 10). Global internet ad spend
by region 2024. Statista.
Internet advertising spending in North America and Western Europe

33
© 2023 All Rights Reserved Garitano Advisors S.L.U.
Social media influenced the second most the category of “Beauty
care & make up” (22.92%), specifically among Gen Z and Millennials
Source: Chevalier, S. (2022, October 25). U.S. Genz/Millennial purchased items due to social media
2021. Statista.
Products that US Gen Z and Millennials buy more due to social media in 2021
34
© 2023 All Rights Reserved Garitano Advisors S.L.U.
Cosmetics follow this global trend, with US and France increasing their
investment of 1,216m USD (US) & 85m USD (France) in 2021
Source: Navarro, J. G. (2023, February 7). U.S.: Cosmetics & Personal Care Display ad spending. Statista.
Cosmetics & personal care display ad spend in the US & France

35
© 2023 All Rights Reserved Garitano Advisors S.L.U.
YouTube (61%) and Facebook (51%) were the most trusted social
networks to find and buy products in the US in 2022
Source: Chevalier, S. (2022, September 23). U.S. most trusted social networks for Social Shopping 2022. Statista.
Most trusted social networks to find and buy products in the US in 2022

36
© 2023 All Rights Reserved Garitano Advisors S.L.U.
In 2021 in the US, 53% of the users shopped on social media at least
one a week
Source: Chevalier, S. (2022, November 18). U.S. social media shopping frequency 2021. Statista.
Social media shopping frequency in the US in 2021

37
© 2023 All Rights Reserved Garitano Advisors S.L.U.
In terms of the most purchase product categories on social media in
2021 in US “Personal care & beauty” came second with 15%
Source: Chevalier, S. (2022, February 17). U.S. main products bought on social media 2021. Statista.
Most purchased product categories on social media in the US

38
© 2023 All Rights Reserved Garitano Advisors S.L.U.
The two most influential social media content in purchasing decisions
are post by friends (71%) and posts by brands (63%)
Source: Chevalier, S. (2022, September 19). U.S. Social Media Content Purchase Influencers 2021. Statista.
Most influential social media content for buyers in the US in 2021

39
© 2023 All Rights Reserved Garitano Advisors S.L.U.
Out of the share users who discovered a product on social media,
82% of them purchased it directly on their phone
Source: U.S. mobile shopping by social media discovery 2021 | statista. (n.d.).
Mobile shopping after discovery in social media in the US in 2021

40
© 2023 All Rights Reserved Garitano Advisors S.L.U.
Dior, L’Oréal Paris and Lancôme were the most influential beauty
brands globally in the first half of 2022, with a MIV above 337
Source: Most influential beauty brands on media 2022 | statista. (n.d.).
Media Impact Value™ (MIV®) allows brands to assign a monetary value to every post, interaction or article to
measure its impact and identify contributions to brand performance across Voices, channels and regions.
Leading global beauty brands based on Media Impact Value H1 2022

41
© 2023 All Rights Reserved Garitano Advisors S.L.U.
Leading goals of social media marketers are engagement (62%) and
reach (60%), but there is a big opportunity for monetization
Source: Published by S. Dixon, & 22, M. (2022, March 22). U.S. beauty brands by Social Media User Engagement
2020. Statista.
Creators refers to the people responsible for creating and uploading content social media, also called influencers
Leading creator marketing goals in the US in 2022

42
© 2023 All Rights Reserved Garitano Advisors S.L.U.
Based on the number of Instagram followers, Kylie Cosmetics &
Anastasia Beverly Hills were the most popular brands online
Source: Published by S. Dixon, & 23, M. (2022, March 23). Instagram: Most-followed Beauty Brands 2022.
Statista.
Leading beauty brands ranked by number of Instagram followers as of March 2022

43
© 2023 All Rights Reserved Garitano Advisors S.L.U.
Sandra Cires Art channel was the most popular YouTube beauty
channel as of November 2022, with 16.30 millions of subscribers
Source: Published by L. Ceci, & 18, N. (2022, November 18). YouTube top beauty and makeup channels 2022.
Statista.
YouTube: most subscribed beauty content creators 2022

44
© 2023 All Rights Reserved Garitano Advisors S.L.U.
ORGANIC TRENDS

45
© 2023 All Rights Reserved Garitano Advisors S.L.U.
Executive Summary
The revenue growth of natural cosmetics worldwide
is rapidly growing, with an average growth of 6.94%.
From a negative growth rate of 2.90% in 2015, it has
been increasing ever since and is expected to keep on
growing for the years to come. (S46)
The growth rate of natural and organic personal care
between the years 2018 and 2028 is faster in North
America (9.10%) than on a global scale (8.30%).
(S47)
For women in the US in 2016, skin care and hair care
were the most important categories to buy all-natural
products, with 57% and 51%, respectively, of the
respondents agreeing. (S51)
The sustainable personal care market share of
Millennials is expected to decrease by 2% in the UK by
2025. (S53)
50% of Gen Z said they would not buy from skin care
products from brands that are not justified as
cruelty-free, in the US in 2021.
(S54)

46
© 2023 All Rights Reserved Garitano Advisors S.L.U.
In terms of trend, it can be noted that the natural cosmetics
worldwide is growing, with an average growth of 6.94%
Source: Published by Statista Research Department, & 16, N. (2022, November 16). Global: Natural and organic
market revenue growth. Statista.
Annual revenue growth of the natural and organic cosmetics market worldwide

47
© 2023 All Rights Reserved Garitano Advisors S.L.U.
The growth rate of natural and organic personal care is faster in
North America (9.10%) than on a global scale (8.30%)
Source: Petruzzi, D. (2022, February 2). Organic Personal Care Market-growth worldwide 2018-2028. Statista.
Growth of the global and North American natural personal care in 2018-2028

48
© 2023 All Rights Reserved Garitano Advisors S.L.U.
42% of the respondents in US used mostly organic cosmetics, with 40%
using either or equally. As opposed to 18% using mostly conventional
Source: Kunst, A. (2019, December 20). Makeup: Share of Organic Products U.S. 2017. Statista.
Share of organic makeup products bought by US consumers in 2017

49
© 2023 All Rights Reserved Garitano Advisors S.L.U.
The main reason for using natural and organic beauty products was
for “health for my body” in 2022, with a 50% rate responses
Source: Shahbandeh, M. (2022, November 2). Natural and organic beauty: Main motivating factors in
Europe 2022. Statista.
Main motivations for using natural and organic beauty products in 2022 in EU

50
© 2023 All Rights Reserved Garitano Advisors S.L.U.
In US, most important attributes for beauty/ personal care were:
“clean” products (47%) and made of “natural ingredients” (47%)
Source: Shahbandeh, M. (2022, October 14). Beauty products: Most important product attributes for consumers
2022. Statista.
Beauty and personal care: important product attributes for US consumers in 2022

51
© 2023 All Rights Reserved Garitano Advisors S.L.U.
For women in the US, skin care (57%) and hair care (51%) were the
most important categories to buy all-natural products
Source: Mikulic, M. (2016, September 27). Importance of bio beauty products for U.S. women by category 2016.
Statista.
Importance of buying all-natural beauty products for US women
in 2016, by category

52
© 2023 All Rights Reserved Garitano Advisors S.L.U.
The leading label to motivate female shoppers in France to buy
cosmetics online in 2022 was “Cosmétiques Bio” (89%)
Source: Published by Lynn Beyrouthy, & 10, O. (2022, October 10). France: Top labels for cosmetic online purchases
2022. Statista.
Most popular labels that motivate shoppers to buy cosmetics online in France 2022

53
© 2023 All Rights Reserved Garitano Advisors S.L.U.
The sustainable personal care market share of Gen Z expected to
grow most rapidly in UK, with CAGR of 10% , by 2025
Source: Published by M. Ridder, & 16, N. (2021, November 16). United Kingdom: Sustainable personal care
market growth 2021. Statista.
Growth of the sustainable person care market with CAGR of market
share in the UK in 2021

54
© 2023 All Rights Reserved Garitano Advisors S.L.U.
50% of Gen Z said they would not buy from skin care products from
brands that are not justified as cruelty-free, in the US in 2021
Source: Petruzzi, D. (2022, December 16). Beauty: Gen z about buying from non cruelty-free brands 2021. Statista.
Willingness of Gen Z to buy from non cruelty-free brands in the
UK and US in 2021

55
© 2023 All Rights Reserved Garitano Advisors S.L.U.
Main reasons to buy natural cosmetics for Gen Z were: environment
(44%), try new things (41%), and better health(40%)
Source: Kunst, A. (2022, March 16). Gen Z drivers of Natural Cosmetics purchases U.S. 2021. Statista.
Gen Z reasons to buy natural cosmetics in the US in 2021
56
© 2023 All Rights Reserved Garitano Advisors S.L.U.
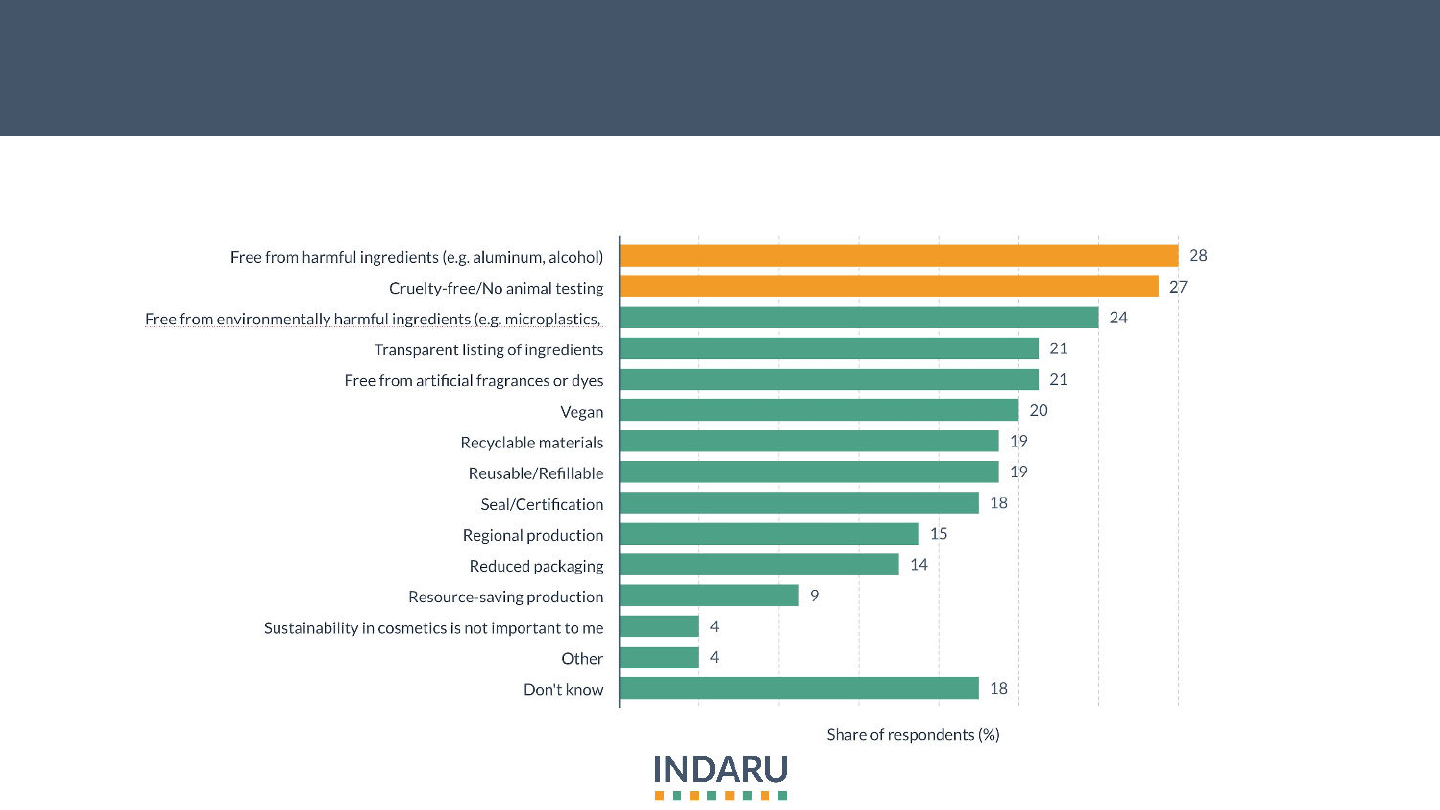
Main criterias for Gen Z for sustainable purchase for cosmetic
products: free from harmful ingredients (28%) and cruelty-free (27%)
Source: Kunst, A. (2022, March 16). Gen Z Sustainable Purchase Criteria for cosmetics U.S. 2021. Statista.
Gen Z sustainable purchase criteria for cosmetic products in the US in 2021

57
© 2023 All Rights Reserved Garitano Advisors S.L.U.
Among the Millennials’ survey of 2017, 43% stated their preference
for natural skin care products
Source: Ad spend of selected personal care brands 2021- US (Jan, 6, 2023). Statistica
Share of Millennials looking for natural skin care products in the US in 2017

58
© 2023 All Rights Reserved Garitano Advisors S.L.U.
The sustainable personal care market share of Millennials is expected
to decrease by 2% in the UK by 2025
Source: Ad spend of selected personal care brands 2021- US (Jan, 6, 2023). Statistica
Growth of the sustainable personal care market with CAGR of
market share in the UK in 2021

59
© 2023 All Rights Reserved Garitano Advisors S.L.U.
CONSUMERS:
GEN-Z

60
© 2023 All Rights Reserved Garitano Advisors S.L.U.
Executive Summary
Gen Z is the generation that used social media most to
search for product information with 44.4% in 2022 in
the US. (S61)
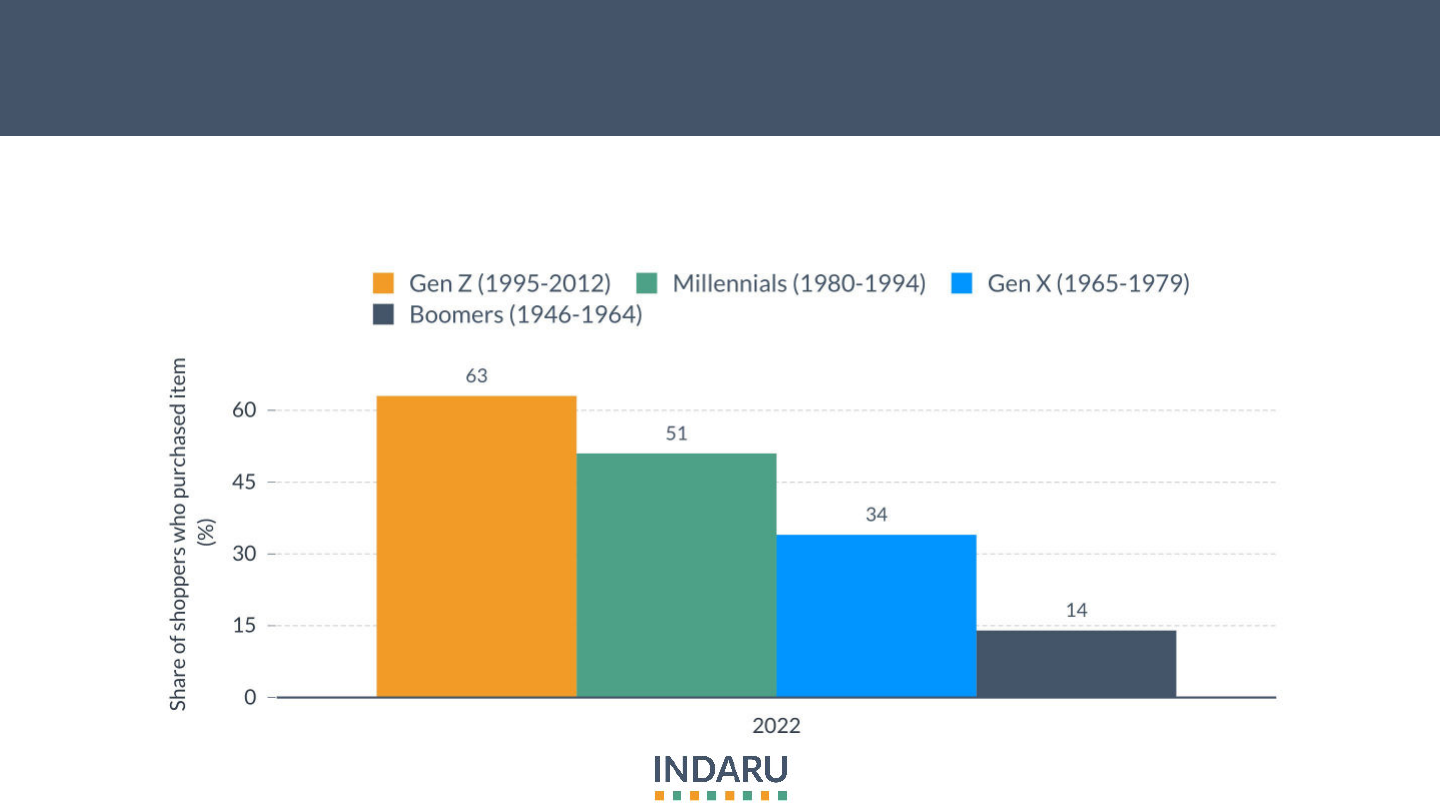
Gen Z were the most influenced by social media,
with 63% buying an item after seeing it on said
platform. (S64)
Social media channels (44%) and internet searches
(40%) were Gen Z’s favorite channels for care product
ideas in the US in 2021. (S68)
Gen Z is the generation that purchased most on
social media, especially within the age range of 18
to 24 with 55.50%. (S69)

61
© 2023 All Rights Reserved Garitano Advisors S.L.U.
Gen Z is the generation that used social media most to search for
product information with 44.4% in 2022 in the US
Source: U.S. social media use for product search by age 2022 | statista. (n.d.).
Social media usage for product search in the US in 2022

62
© 2023 All Rights Reserved Garitano Advisors S.L.U.
Looking at Gen Z, out of brands, influencers and retailers, they were
the most responsive to brands (52%) in 2022
Source: Published by Statista Research Department, & 25, O. (2022, October 25). Global social media accounts
followed and bought from by generation 2022. Statista.
Global social media users on accounts followed and bought from 2022

63
© 2023 All Rights Reserved Garitano Advisors S.L.U.
80% of Gen Z were more willing to try new brands online, however,
over half (57%) were becoming less loyal to brands in 2021
Source: Pasquali, M. (2023, January 18). United States: Gen Z loyalty towards brands 2021. Statista.
More willing
to try new
brands online
Have less
patience with
poorly
functioning
websites
Less loyal to
brands
Abandon a purchase or
post a negative review
with poor digital
shopping experience
Change in loyalty towards brands among US Gen Z shoppers since
COVID19 2021
64
© 2023 All Rights Reserved Garitano Advisors S.L.U.
Gen Z were the most influenced by social media, with 63% buying an
item after seeing it on said platform
Source: Tighe, D. (2022, October 25). U.S. shoppers inspired by social media by age 2022. Statista.
Consumers who bought an item after seeing it on social media in the US
in 2022, by age

65
© 2023 All Rights Reserved Garitano Advisors S.L.U.
Gen Z’s main channels to buy products in the US in 2022 were
“In-Store” (55%), with “Online retailer” just 5% below
Source: U.S.: Main channels for product purchases by age | statista. (n.d.).
Main channels to buy products for consumers in the US in 2022, by generation

66
© 2023 All Rights Reserved Garitano Advisors S.L.U.
43% of Gen Z shopped for beauty & personal care products online in
“Marketplace (ie: Amazon)” back in 2021, in the US
Source: Kunst, A. (2022, March 15). Gen Z cosmetics purchase online channels U.S. 2021. Statista.
Gen Z beauty & personal care purchase online channels in the US in 2021
Gen Z beauty & personal care purchase online channels in the US in 2021

67
© 2023 All Rights Reserved Garitano Advisors S.L.U.
48% of Gen Z shopped for beauty & personal care products offline in
“Big box store/superstore” back in 2021, in the US
Source: Kunst, A. (2022, March 15). Gen Z cosmetics purchase offline channels U.S. 2021. Statista.
Gen Z beauty & personal care purchase offline channels in the US in 2021

68
© 2023 All Rights Reserved Garitano Advisors S.L.U.
Social media channels (44%) and internet searches (40%) were Gen
Z’s favorite channels for care product ideas in the US in 2021
Source: Petruzzi, D. (2022, November 30). United States: Channels used by Gen z for care product ideas. Statista.
Gen Z’s favorite channels for care product ideas in the US in 2021

69
© 2023 All Rights Reserved Garitano Advisors S.L.U.
Gen Z is the generation that purchased the most on social media,
especially within the age range of 18 to 24 with 55.50%
Source: U.S. social buyers by age 2021 | statista. (n.d.).
Share of social media users in the US using social media to make purchases in 2021

70
© 2023 All Rights Reserved Garitano Advisors S.L.U.
Gen Z didn’t have preferred shopping methods, it is divided among
in-store (37%), hybrid (36%), and online as the latter (27%)
Source: Tighe, D. (2023, January 18). Global Online Shopping Trends by generation 2021. Statista.
Preferred shopping methods of consumers, worldwide in 2021

71
© 2023 All Rights Reserved Garitano Advisors S.L.U.
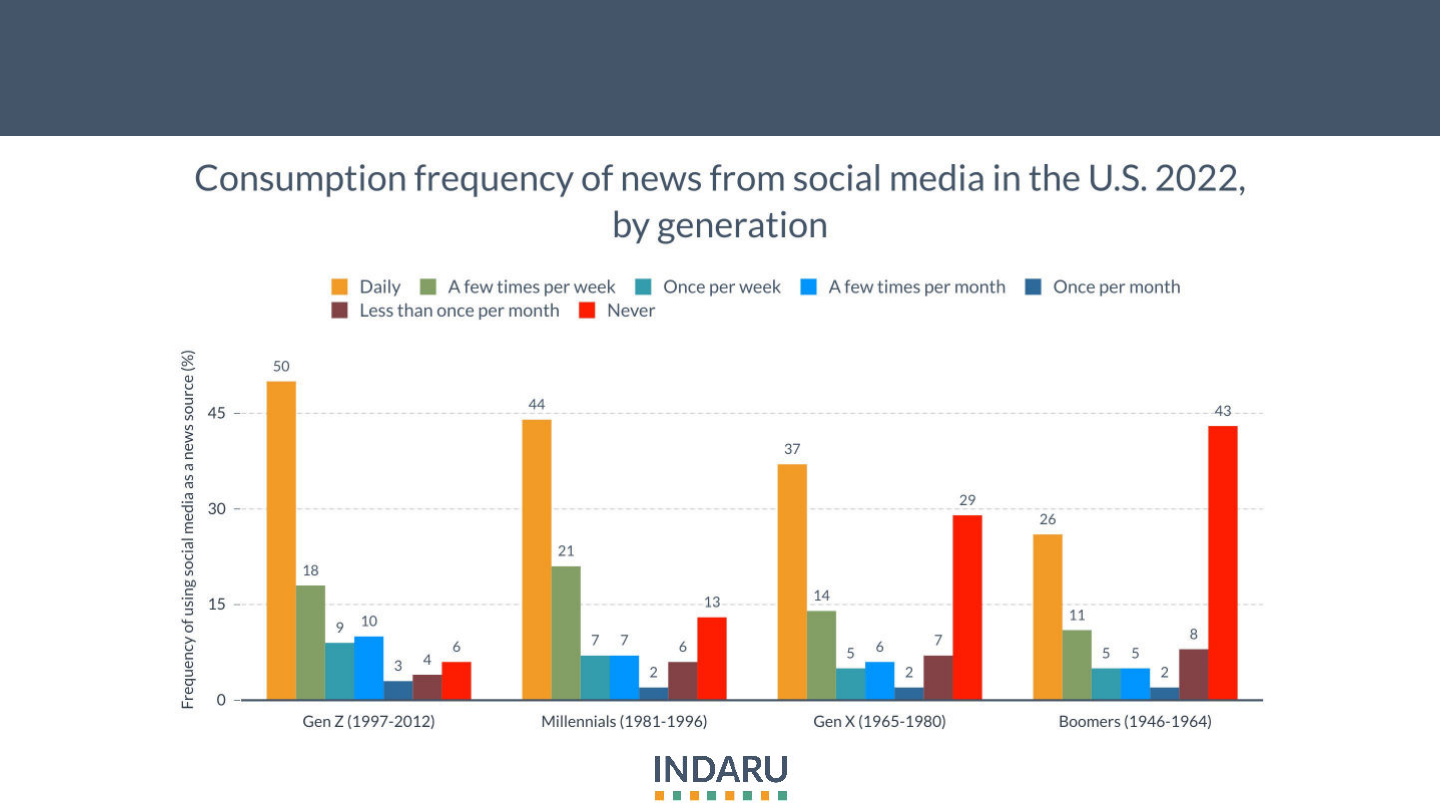
68% of Gen Z used social media daily of a few times per week, while
only 6% never used social media in 2022 in the US
Source: Watson, A. (2022, August 18). News consumption on social media U.S. by generation 2022. Statista.
Consumption frequency of news from social media in the US in 2022

72
© 2023 All Rights Reserved Garitano Advisors S.L.U.
CONSUMERS:
MILLENNIALS

73
© 2023 All Rights Reserved Garitano Advisors S.L.U.
Executive Summary
Millenial’s main channels to buy products in the US in
2022 were “In-Store” (65%), and closely followed by
“Online retailer” (55%). (S76)
Millennials were the most influenced in terms of
purchasing decisions by social media advertising, with
58% in 2021 in the US. (S79)
Millennials were the most responsive to brands(59%),
with retailers as a runner up with 50% back in 2022.
(S82)
Internet searches (46%) and television (42%) were
Millennials’ favorite channels for care product ideas in
the US in 2021.
(S83)
Millennials were most influenced by Facebook (30%)
as a social media network, with Instagram as the
runner up (23%) in 2022 in the US. (S84)

74
© 2023 All Rights Reserved Garitano Advisors S.L.U.
50% of Millennials stated that they preferred to purchase in-store
cosmetics/ personal care in 2019
Source: Tighe, D. (2020, November 27). Millennial in-store shopping preferences worldwide 2019. Statista.
Products Millennials prefer to purchase in-store globally in 2021

75
© 2023 All Rights Reserved Garitano Advisors S.L.U.
In 2021, 51% of the Millennials surveyed stated that in-store
experience when shopping is important
Source: Petruzzi, D. (2023, January 18). Beauty and health products: Importance of the in-store experience 2021.
Statista.
Importance of the in-store experience for beauty purchases worldwide in 2021

76
© 2023 All Rights Reserved Garitano Advisors S.L.U.
Millenial’s main channels to buy products in the US in 2022 were
“In-Store” (65%), and closely followed by “Online retailer” (55%)
Source: U.S.: Main channels for product purchases by age | statista. (n.d.).
Main channels to buy products for consumers in the US in 2022

77
© 2023 All Rights Reserved Garitano Advisors S.L.U.
Millennials leaned slightly towards “in-store” (38%), with “online”
(32%) and “hybrid” (30%) not to far behind
Source: Tighe, D. (2023, January 18). Global Online Shopping Trends by generation 2021. Statista.
Preferred shopping methods of consumers, worldwide in 2021

78
© 2023 All Rights Reserved Garitano Advisors S.L.U.
In terms of loyalty, Millennials are 51% loyal to at least one brand in
the cosmetics/personal care industry back in 2019
Source: Tighe, D. (2020, November 27). Millennial loyalty to Brands Worldwide by category 2019. Statista.
Product categories which Millennials are loyal to globally in 2019

79
© 2023 All Rights Reserved Garitano Advisors S.L.U.
Millennials were the most influenced in terms of purchasing decisions
by social media advertising, with 58% in 2021 in the US
Source: Published by Statista Research Department, & 10, J. (2023, January 10). Social media influence on
purchase decisions by age USA 2021. Statista.
80
© 2023 All Rights Reserved Garitano Advisors S.L.U.
65% of Millennials used social media daily of a few times per week,
while 13% never used social media in 2022 in the US
Source: Watson, A. (2022, August 18). News consumption on social media U.S. by generation 2022. Statista.

81
© 2023 All Rights Reserved Garitano Advisors S.L.U.
Millennials were most influenced by Facebook (30%) as a social media
network, with Instagram as the runner up (23%) in 2022 in the US
Source: Chevalier, S. (2022, September 23). Most Influential Social Networks on U.S. Millennial Shoppers 2022.
Statista.
Most influential social networks of the US millennials buyers in 2022

82
© 2023 All Rights Reserved Garitano Advisors S.L.U.
Millennials were the most responsive to brands (59%), with retailers as
a runner up with 50% back in 2022
Source: Published by Statista Research Department, & 25, O. (2022, October 25). Global social media accounts
followed and bought from by generation 2022. Statista.
Global social media users on accounts followed and bought from 2022

83
© 2023 All Rights Reserved Garitano Advisors S.L.U.
Internet searches (46%) and television (42%) were Millennials’
favorite channels for care product ideas in the US in 2021
Source: Petruzzi, D. (2022, June 21). United States: Channels used by Millennials For Care Product Ideas. Statista.
Millennials’ favorite channels for care product ideas in the US in 2021

84
© 2023 All Rights Reserved Garitano Advisors S.L.U.
41.8% of Facebook users in US were Millennials, making up its largest
audience, with the smallest audience (3.9%) being teens (13-17)
Source: Published by S. Dixon, & 9, J. (2023, January 9). U.S. facebook demographics Age 2022. Statista.
US Facebook users in 2022, by age groups

85
© 2023 All Rights Reserved Garitano Advisors S.L.U.
In US, Millennials (18-25) spend an average of 10.5 hours per week on
Tiktok - the most out of other social media and age group
Source: Published by L. Ceci, & 18, J. (2023, January 18). U.S. top apps weekly engagement by age group 2021.
Statista.
US app user engagement in 2021, by age group

86
© 2023 All Rights Reserved Garitano Advisors S.L.U.
CONSUMERS:
Gen X

87
© 2023 All Rights Reserved Garitano Advisors S.L.U.
Executive Summary
Gen X was the generation with most annual
household expenditures (83K) back in 2021 in the
US. (S88)
Gen X were most influenced by both retailers
(54%) and brands (51%), back in 2022. (S91)
51% of Gen X used social media daily of a few
times per week, while 29% of Gen X never used
social media in 2022 in the US. (S93)
The digital shoppers from Gen X barely use social
media for shopping. 17% used Facebook (17%) in the
US & 9% Instagram. (S94)
88
© 2023 All Rights Reserved Garitano Advisors S.L.U.
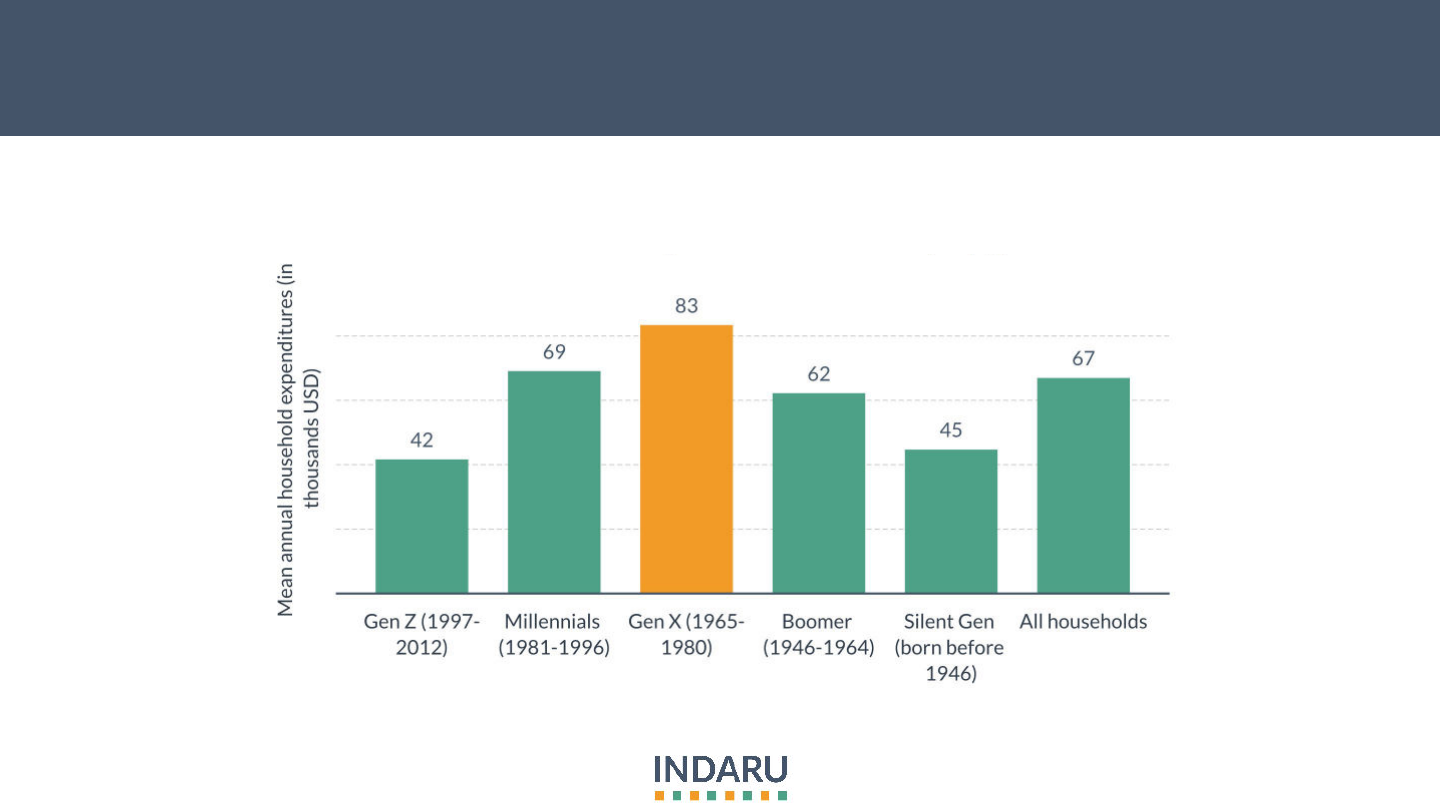
Gen X was the generation with most annual household expenditures
(83K) back in 2021 in the US
Source: Published by Statista Research Department, & 12, O. (2022, October 12). Annual household expenditures
by generation U.S. 2021. Statista.
US annual household expenditures in 2021

89
© 2023 All Rights Reserved Garitano Advisors S.L.U.
Gen X’s main channels to buy products in the US in 2022 were
“In-Store” (73%) by far, followed by “Online retailer” (53%)
Source: U.S.: Main channels for product purchases by age | statista. (n.d.).
Main channels to buy products for consumers in the US in 2022

90
© 2023 All Rights Reserved Garitano Advisors S.L.U.
Gen X clearly prefers “in-store” (60%) purchases
Source: Tighe, D. (2023, January 18). Global Online Shopping Trends by generation 2021. Statista.
Preferred shopping methods of consumers, worldwide in 2021

91
© 2023 All Rights Reserved Garitano Advisors S.L.U.
Gen X were most influenced by both retailers (54%) and brands (51%),
back in 2022
Source: Published by Statista Research Department, & 25, O. (2022, October 25). Global social media accounts
followed and bought from by generation 2022. Statista.
Global social media users on accounts followed and bought in 2022

92
© 2023 All Rights Reserved Garitano Advisors S.L.U.
67% of Gen X stated that their favored channel to be contacted by
brands was email, in 2022 in the US
Source: Published by Julia Faria, & 10, J. (2023, January 10). Gen X top channels to be contacted by Brands
USA 2022. Statista.
Gen X preferred channels to be contacted by brands in 2022

93
© 2023 All Rights Reserved Garitano Advisors S.L.U.
51% of Gen X used social media daily of a few times per week, while
29% of Gen X never used social media in 2022 in the US
Source: Watson, A. (2022, August 18). News consumption on social media U.S. by generation 2022. Statista.
Consumption frequency of news from social media in the US in 2022

94
© 2023 All Rights Reserved Garitano Advisors S.L.U.
The digital shoppers from Gen X barely use social media for shopping,
17% used Facebook in the US & 9% Instagram
Source: Chevalier, S. (2022, October 11). U.S. Top Social Commerce platforms by age 2022. Statista.
Social commerce platforms most used by digital shoppers in the US in 2022

95
© 2023 All Rights Reserved Garitano Advisors S.L.U.
ADVERTISING

96
© 2023 All Rights Reserved Garitano Advisors S.L.U.
Executive Summary
The main medium for ads for beauty and personal
luxury was TV (44.6%) followed closely by digital
(36%). (S97)
The digital ad spending in the US “Pharma &
healthcare” made up 11% of the total advertising
spending in 2022 in the country. (S102)
Mobile is overtaking desktop worldwide, with mobile
increasingly eating away at desktop use, with 68.7%
(mobile) compared to 31.3% (desktop) in 2025.
(S110)
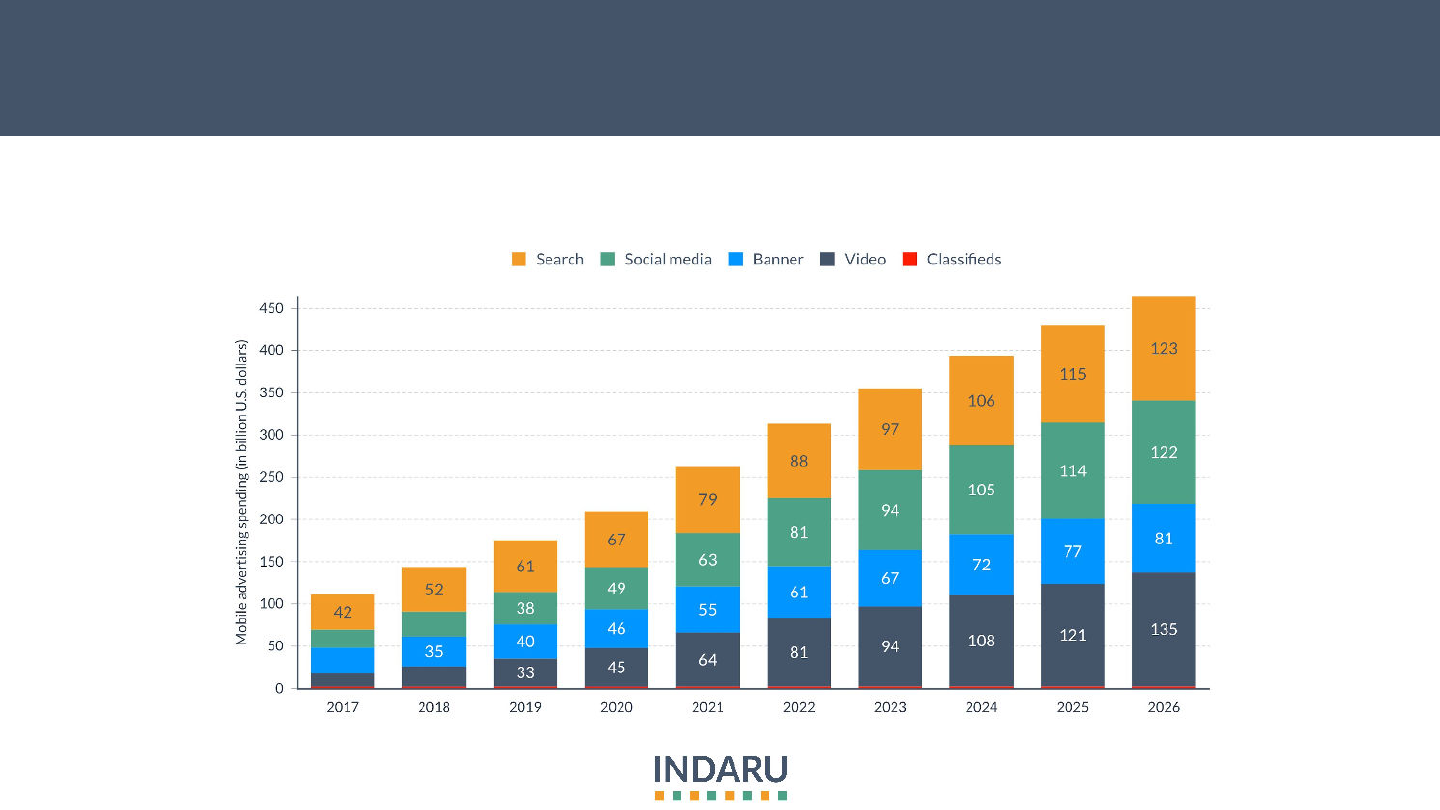
Search advertising was the mobile advertising format
with the highest spending in the US, with 78.51billion
USD in spending. (S112)
The digital ad spending in Western Europe in 2021
was largely dominated by display (38b USD) and
search (35b USD). (S113)

97
© 2023 All Rights Reserved Garitano Advisors S.L.U.
The main medium for ads for beauty and personal luxury was TV
(44.6%) followed closely by digital (36%)
Source: Published by Julia Faria, & 6, J. (2023, January 6). Beauty ad spend share by medium worldwide 2020.
Statista.
Beauty and personal luxury ad spend share worldwide in 2020

98
© 2023 All Rights Reserved Garitano Advisors S.L.U.
In 2022, internet advertising spending in Western Europe reached 82
million USD and is expected to reach 96 million USD by 2024
Source: Published by Statista Research Department, & 6, J. (2023, January 6). Online advertising spending in
Western Europe 2024. Statista.
Online advertising spending in Western Europe

99
© 2023 All Rights Reserved Garitano Advisors S.L.U.
In 2021, UK was the largest digital advertising market in Western
Europe (32b EUR) and together make up 78b EUR
Source: Published by Statista Research Department, & 6, J. (2023, January 6). Western Europe: Digital ad spend by
country 2021. Statista.
Digital ad spend in Western Europe in 2021

100
© 2023 All Rights Reserved Garitano Advisors S.L.U.
From 2020 to 2021, digital audio ad spend in the US increased by 58%,
from 3.09 billion USD in 2020 to 4.87 USD in 2021
Source: Published by Statista Research Department, & 10, J. (2023, January 10). Digital Audio ad spend in the U.S.
2021. Statista..
Digital audio ad spend in the US

101
© 2023 All Rights Reserved Garitano Advisors S.L.U.
Digital video ad spending in the US is projected to grow from 63.8
billion USD in 2021 to 134.5 billion USD in 2026
Source: Published by Statista Research Department, & 10, J. (2023, January 10). Digital Market Outlook: U.S. digital
advertising spending by format 2026. Statista.
Digital advertising spending in the US by format

102
© 2023 All Rights Reserved Garitano Advisors S.L.U.
The digital ad spending in the US “Pharma & healthcare” made up 11%
of the total advertising spending in 2022 in the country
Source: Published by Statista Research Department, & 20, J. (2023, January 20). Digital Market Outlook: U.S.
Digital Advertising Spending Share by industry 2022. Statista.
Distribution of digital advertising spending in the US in 2022, by industry

103
© 2023 All Rights Reserved Garitano Advisors S.L.U.
Television (46%), print (46%) and radio (45%) were the most trusted
medium for advertising in 2021 in the US
Source: Navarro, J. G. (2023, January 6). Trust in advertising in the U.S. media 2021. Statista.
Trust in advertising in the US in 2021, by medium

104
© 2023 All Rights Reserved Garitano Advisors S.L.U.
However, in Western Europe, spending in “Television” is decreasing
and is being overtaken by spending in “Internet”
Source: Navarro, J. G. (2023, January 6). Ad spend by medium in Western Europe 2024. Statista.
Advertising spending in Western Europe

105
© 2023 All Rights Reserved Garitano Advisors S.L.U.
Women (82%) used skin care products on daily basis/several times a
week, making them the main decision makers in the cosmetics market
Source: Kunst, A. (2019, December 20). Skin care products: Frequency of use by gender U.S. 2017. Statista.
Frequency of use of skin care products among US consumers in 2017

106
© 2023 All Rights Reserved Garitano Advisors S.L.U.
Gen Z (41%) and Millennials (40%) were the two age group segments
that spent the most on skin care in the beauty sector in the US, 2021
Source: Petruzzi, D. (2022, March 1). United States: Skin care shoppers, by age group 2021. Statista.
Shoppers spending most on skin care in the beauty sector in the US in 2021
107
© 2023 All Rights Reserved Garitano Advisors S.L.U.
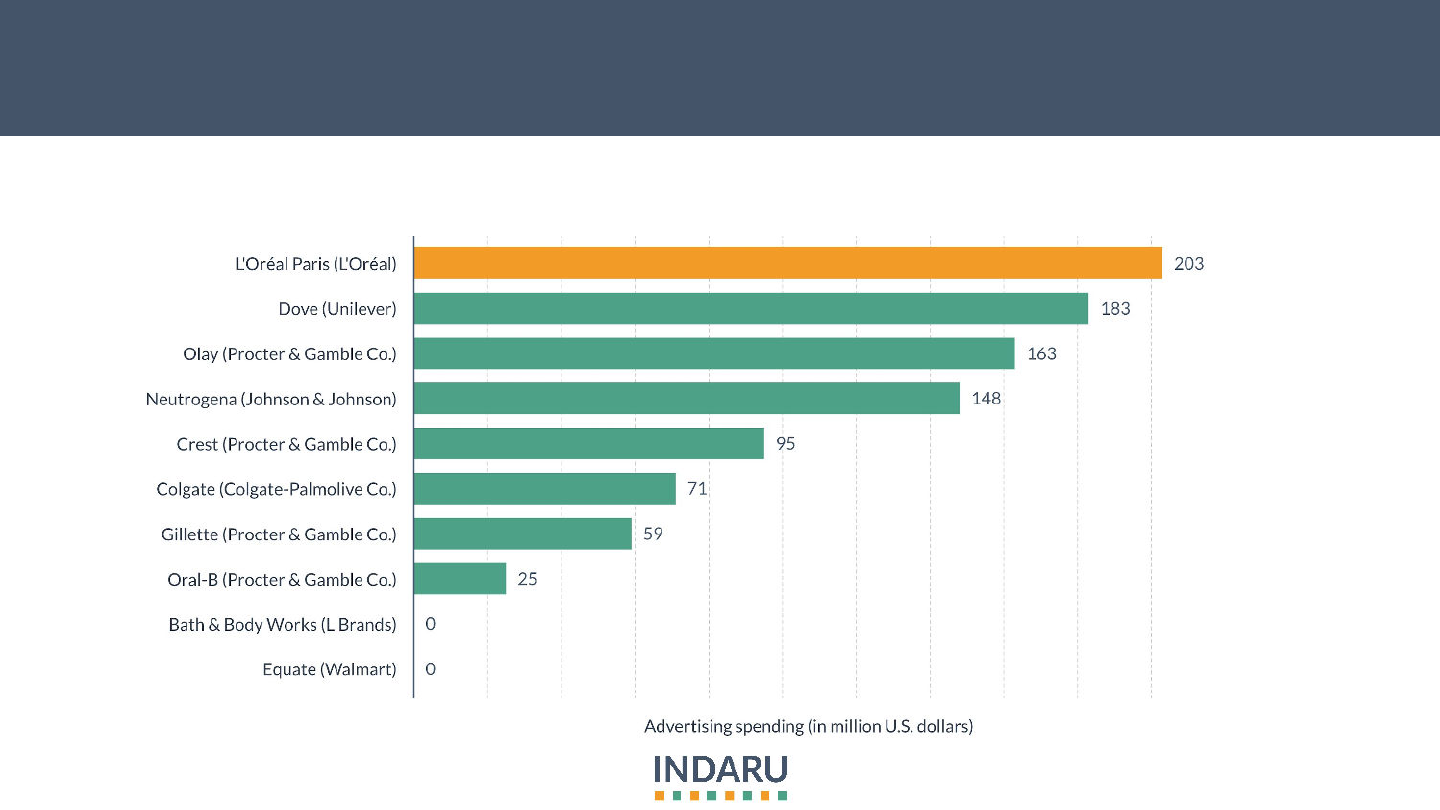
L’Oréal spent the most in advertisement for its product “L’Oréal Paris”
in the US, with 203 million USD in 2021
Source: Published by Julia Faria, & 6, J. (2023, January 6). Ad spend of selected Personal Care Brands in
the U.S. 2021. Statista.
Ad spend of selected personal care brands in the US in 2021

108
© 2023 All Rights Reserved Garitano Advisors S.L.U.
Awareness was not impacted by ad spend, as seen with Gillette
having the lowest ad spend and similar awareness levels as others
Source: (1) Beiersdorf. In Statista. ; (2) Estée Lauder. In Statista. ; (3) L'Oréal. In Statista. ; (4) Avon Products
Inc.. In Statista. ; (5) Coty Inc.. In Statista. ; (6) Procter & Gamble Inc.. In Statista. ; (7) Unilever. In Statista.
Impact of brand’s absolute ad expenditure on different brand metrics for
selected brands in the US in 2021

109
© 2023 All Rights Reserved Garitano Advisors S.L.U.
In terms of social media, ads will bring the highest ROI (67%) in 2030 in EU,
according to a survey among leaders of largest e-commerce retailers in EU
Source: Published by Statista Research Department, & 6, J. (2023, January 6). Top e-commerce Marketing
Channels Europe 2020-2030. Statista.
Marketing channels yielding highest return on investment (ROI) according to
e-commerce retailers in EU
110
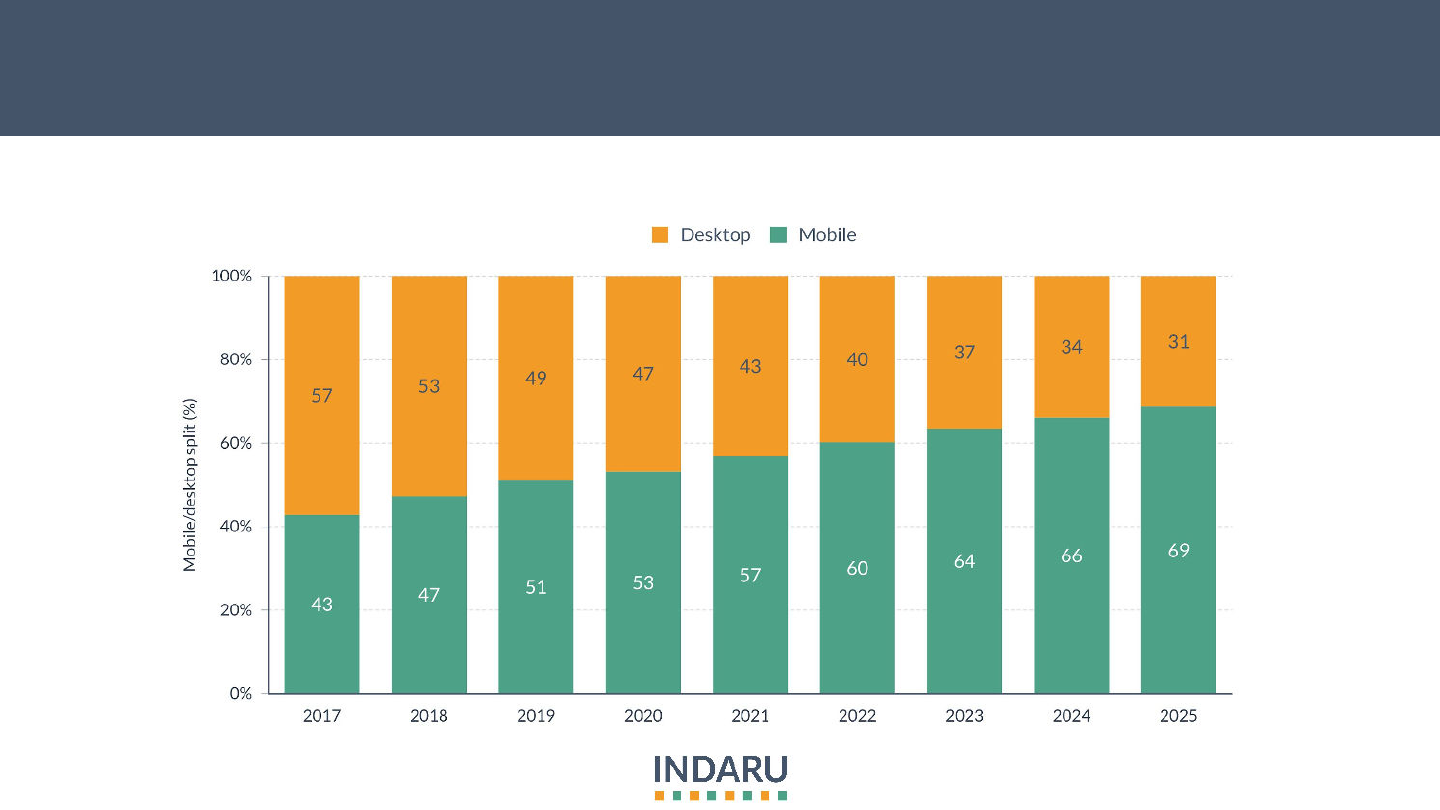
© 2023 All Rights Reserved Garitano Advisors S.L.U.
Mobile usage as a sales channel has overtaken desktop, making up
63.5% of the sales in 2023 compared to 36.5% for desktop
Source: Cosmetics - worldwide: Statista market forecast. Statista. (n.d.).
Desktop and mobile split worldwide

111
© 2023 All Rights Reserved Garitano Advisors S.L.U.
However, when looking specifically at US and EU, there is still a
balance mix between mobile and desktop
Source: Beauty & Personal Care - US: Statista market forecast. Statista. (n.d.).
Desktop and mobile split in 2022 in the US and EU
112
© 2023 All Rights Reserved Garitano Advisors S.L.U.
Search advertising was the mobile advertising format with the highest
spending in the US, with 78.51billion USD in spending
Source: Published by Statista Research Department, & 6, J. (2023, January 6). Mobile ad spend in the U.S.
2017-2026. Statista.
Mobile ad spend in the US by format
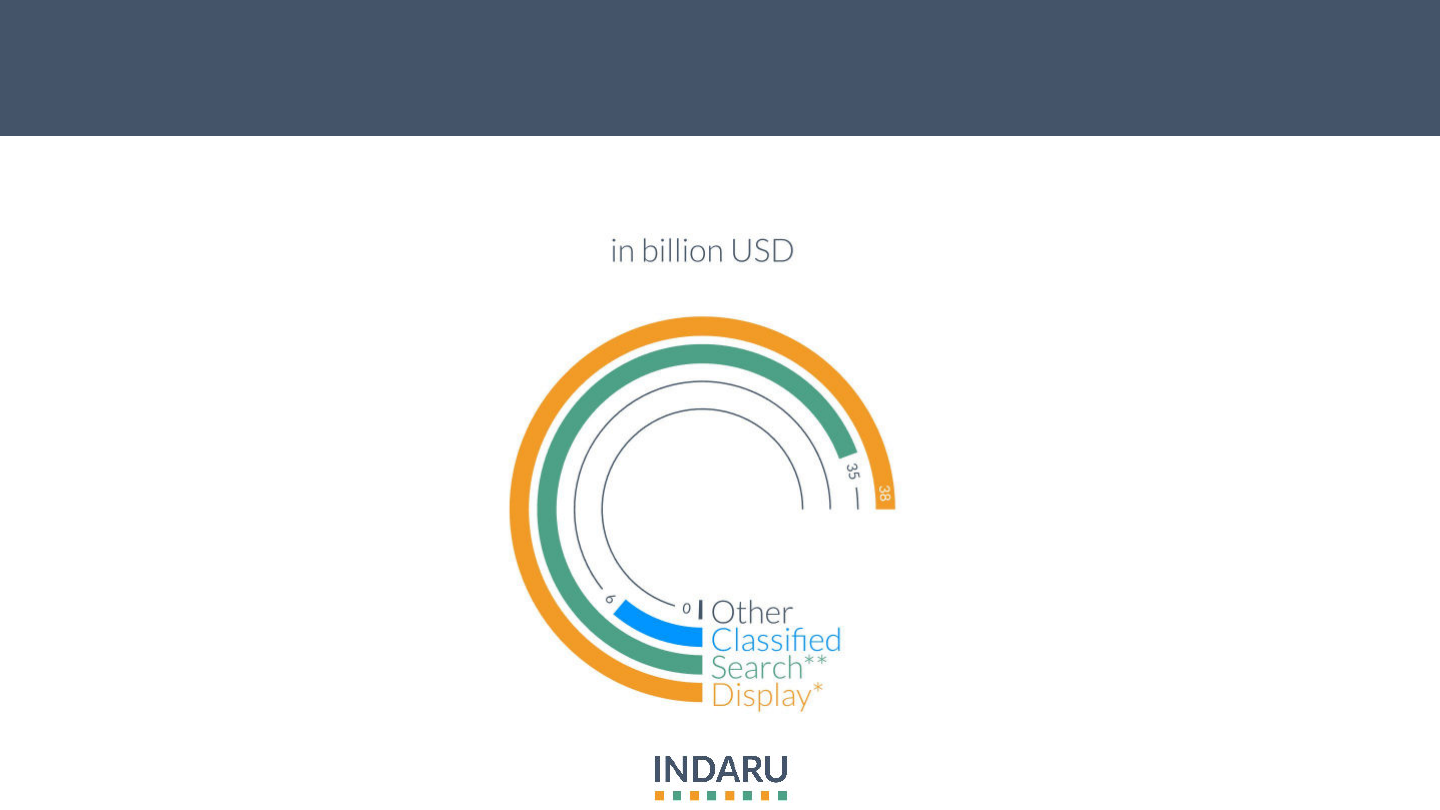
113
© 2023 All Rights Reserved Garitano Advisors S.L.U.
The digital ad spending in Western Europe in 2021 was largely
dominated by display (38b USD) and search (35b USD)
Source: Published by Statista Research Department, & 6, J. (2023, January 6). Western Europe: Digital Ad spend by
format 2021. Statista.
Digital ad spend in Western Europe 2021, by format

114
© 2023 All Rights Reserved Garitano Advisors S.L.U.
66% of consumers in North America and 50% in Europe took no action
on mobile advertising worldwide as of Sept. 2021
Source: Published by Statista Research Department, & 6, J. (2023, January 6). Mobile Advertising Response
Worldwide 2021. Statista.
Consumers who took no action on mobile advertising worldwide in 2021

115
© 2023 All Rights Reserved Garitano Advisors S.L.U.
Online audio is expected to take larger share of consumers’ media
time than what is being invested in it
Source: Navarro, J. G. (2023, January 6). Time spent with media vs. ad spend in the U.S. 2022. Statista.
A number above 0 indicates that the medium's share of advertising spending is larger than its share of
consumption, and a number below 0 indicates that the medium's share of advertising spending is smaller than
its share of consumption.
Difference between advertising spending and time spent with selected media in the
US in 2022 (index score)

116
© 2023 All Rights Reserved Garitano Advisors S.L.U.
Though still early in the development of the metaverse, “Cosmetics”
has its place in it with 166 bn USD of potential sales in the US in 2022
Source: Alsop, T. (2022, July 5). U.S. Metaverse Potential Consumer Expenditure Tam. Statista.
US metaverse potential consumer expenditure TAM 2022

