
Electric
Utility
Performance
A STATE-BY-STATE DATA REVIEW
PRODUCED BY THE
CITIZENS UTILITY BOARD (CUB)

Electric Utility Performance: A State-by-State Data Review
was produced by the Citizens Utility Board (CUB)
The Citizens Utility Board (CUB) wishes to thank Douglas Jester and 5 Lakes Energy LLC
for their work in developing this report.
ELECTRIC UTILITY PERFORMANCE: A STATE-BY-STATE DATA REVIEW
A
FIGURES
Figure 1: 2019 Average Monthly Cost of Electricity Bills....................................................7
Figure 2: 2019 Average Annual Cost of Household Energy Expenditures ......................................8
Figure 3: 2019 Average Annual Household Electricity Costs as a Percentage of Median Income ...................9
Figure 4: 2019 Average Annual Residential Electricity Expenditures .........................................10
Figure 5: 2020 Average Annual Electricty Cost per Kilowatt-Hour For Residential Customers ....................11
Figure 6: 2020 Average Annual Electricity Cost per Kilowatt-Hour For All Customers (Residential, Commercial,
Industrial) ....................................................................................12
Figure 7: Average Duration of Power Outages per Year per Customer, in Minutes (SAIDI) with Major Event Days .....16
Figure 8: Average Duration of Power Outages per Year per Customer, in Minutes (SAIDI) without Major Event Days ..17
Figure 9: Average Amount of Time to Restore Power per Customer, in Minutes (CAIDI) with Major Event Days .......18
Figure 10: Average Amount of Time to Restore Power per Customer, in Minutes (CAIDI) without Major Event Days ...19
Figure 11: Average Frequency of Power Outages per Customer, in Number of Outages (SAIFI) with Major
Event Days ...................................................................................20
Figure 12: Average Frequency of Power Outages per Customer, in Number of Outages (SAIFI) without Major
Event Days ...................................................................................21
Figure 13: 2020 Renewable Electricity Generation, in Terawatt-Hours .......................................25
Figure 14: 2020 Clean Electricity Generation, in Terawatt-Hours............................................26
Figure 15: Map of 2019 Renewable Electricity Generation and Renewable Imports, as a Percentage of Sales .......27
Figure 16: Map of 2019 Clean Electricity Generation and Clean Imports, as a Percentage of Sales . . . . . . . . . . . . . . . .27
Figure 17: 2019 Renewable Electricity Generation and Renewable Imports, as a Percentage of Sales ..............28
Figure 18: 2019 Clean Electricity Generation and Clean Imports, as a Percentage of Sales ......................29
Figure 19: Map of 2019 Fossil Electricity Generation and Fossil Imports, as a Percentage of Sales ................30
Figure 20: 2019 Carbon Dioxide Emissions from the Electric Sector, in Millions of Metric Tons ...................31
Figure 21: 2019 Sulfur Dioxide Emissions from the Electric Sector, in Thousands of Metric Tons . . . . . . . . . . . . . . . . . .32
Figure 22: 2019 Nitrogen Oxide Emissions from the Electric Sector, in Thousands of Metric Tons .................33
Figure 23: 2019 Carbon Dioxide Emissions from Electricity Generation, in Metric Tons per Gigawatt-Hour ..........34
Figure 24: 2019 Sulfur Dioxide Emissions from Electricity Generation, in Metric Tons per Gigawatt-Hour ...........35
Figure 25: 2019 Nitrogen Oxide Emissions from Electricity Generation, in Metric Tons per Gigawatt-Hour ..........36
Electric Utility Performance: A State-By-State Data Review
TABLES
Table 1: State Rankings on Overall Utility Performance ....................................................3
Table 2: Affordability Rankings (Alphabetical)............................................................5
Table 3: Affordability Rankings (Best-to-Worst) ..........................................................6
Table 4: Reliability Rankings (Alphabetical).............................................................14
Table 5: Reliability Rankings (Best-to-Worst) ...........................................................15
Table 6: Environmental Rankings (Alphabetical) .........................................................23
Table 7: Environmental Rankings (Best-to-Worst) .......................................................24
TABLE OF CONTENTS
Introduction ......................................................................................1
Affordability Metrics................................................................................4
Utility Reliability and Performance Metrics.............................................................13
Environmental Metrics .............................................................................22
Conclusion ......................................................................................37

ELECTRIC UTILITY PERFORMANCE: A STATE-BY-STATE DATA REVIEW
B
DATA SOURCES
Although the data in this report come from publicly accessible sources, these sources do not share this information
in ways that are accessible and meaningful to most people. This report puts these data in the context of three key
benchmarks of utility performance: affordability, reliability, and environmental responsibility. The comparative
rankings can help interested and engaged citizens compare the performance and characteristics of their state’s
utilities relative to national peers.
Most of the data in this report come from the Energy Information Administration (EIA) of the U.S. Department of
Energy — a federal entity tasked with the aggregation and dissemination of information about the American energy
industry, and trends in energy uses, sources, reliability, and efciency. The majority of gures are for 2019, because
of a time lag in reporting on the part of the utilities. The other data sources used to compile this report include the
U.S. Census Bureau’s American Community Survey, the Environmental Protection Agency (EPA), and more.
In all of the gures, the states are ranked from best to worst.
GLOSSARY
TERMS AND ABBREVIATIONS
•
ACS: American Community Survey
•
CAIDI: Customer Average Interruption Duration Index
•
CO2: Carbon Dioxide
•
EIA: Energy Information Administration
•
EPA: Environmental Protection Agency
•
IEEE: Institute of Electrical and Electronics Engineers
•
MED: Major Event Days
•
NOx: Nitrogen Oxides of Multiple Types
•
RPS: Renewable Portfolio Standard
•
SAIDI: System Average Interruption Duration Index
•
SAIFI: System Average Interruption Frequency Index
•
SEDS: State Energy Data System
•
SO2: Sulfur Dioxide
UNITS OF MEASUREMENT
•
GWh/Gigawatt-hour: one million kilowatt-hours
•
kWh/Kilowatt-hour: a unit of electricity measurement typical on U.S. electric bills, the average American
household uses about 11,000 kWh per year.
•
Metric Ton: one million grams or 2,204.6 pounds
•
MMBTU: one million British thermal units, equivalent to 293.07 kWh
•
MWh/Megawatt-hour: one thousand kilowatt-hours
•
TWh/Terawatt-hour: one billion kilowatt-hours

ELECTRIC UTILITY PERFORMANCE: A STATE-BY-STATE DATA REVIEW
1
Introduction
E
lectric Utility Performance: A State-by-State Data Review represents a comprehensive ranking of electric utility
performance in every state in America on the key public interest metrics of affordability, reliability, and
environmental responsibility. It’s a landmark analysis that arrives at a climactic moment in the United States.
By the time of this report’s publication:
•
The continuing economic woes caused by the Coronavirus pandemic left millions of American households with less
money to pay their electricity costs, exacerbating preexisting conditions that already plagued lower-income and
environmental justice communities with disproportionately burdensome energy bills.
•
Texas consumers had been pummelled by pervasive power outages and skyrocketing electricity costs after a
winter deep freeze caused a deadly energy crisis.
•
Hurricane Ida had barreled into the Gulf Coast, and then careened toward the Northeast. The storm left New
Orleans in the dark for more than a week, while producing oodwaters that turned Manhattan subways and
Philadelphia expressways into life-threatening rapids.
•
A chain of massive wildres had burned for months along the West Coast and spewed enough smoke to leave a
visible haze along the Atlantic.
Problems like these, which are growing in frequency and intensity in the U.S., attest to the profound challenges that
the coming decades portend for our electricity infrastructure —and prove how important utility performance will be to
our ability to adapt and thrive.
Meanwhile, the pace and scope of technological innovation, and the onus to curb climate change through the
increased use of clean power sources, will likely boost demand for electricity. The need for reliable, affordable power
is a unifying theme of our existence. In matters of culture and lifestyle, we use apps to bank or shop, digital portals to
attend school or a medical appointment, streaming platforms for entertainment — to name just a few. All of this
technology requires massive data centers that are sometimes the largest single customer of electric utilities. And
when it comes to our future environmental security, the electrication of both our transportation system and buildings
is a critical part of the strategy to meet our climate change commitments.
Against this backdrop, the Citizens Utility Board (CUB) has compiled a comprehensive assessment of electric utility
performance across all 50 states. Based on publicly available data, this analysis rates each state’s residential utilities
on the three core standards that indicate whether a power provider is meeting its fundamental obligations to
customers:
•
Affordability.
•
Reliability.
•
Environmental responsibility.
ELECTRIC UTILITY PERFORMANCE: A STATE-BY-STATE DATA REVIEW
1

ELECTRIC UTILITY PERFORMANCE: A STATE-BY-STATE DATA REVIEW
2
The report includes a composite score and a
corresponding ranking of states and the District
of Columbia from 1 to 51 — or best to worst —for
overall utility performance. This score is an
average of a state’s rankings within those three
core categories of reliability, affordability and
environmental responsibility. These metrics
afford us a consistent scale to quantify and
compare utility performance across the country
over time, pinpointing areas where policymakers
in each state can focus efforts to unleash
untapped potential for lower energy costs, better
electricity service, and a cleaner environment.
Simply put, policymakers can’t improve what
they don’t measure.
By the same token, for states that fare well in
this inaugural edition of the performance
ranking, this report shouldn’t be regarded as a
license to coast. The rankings of states reect their performance relative to each other —but there is ample room for
even the top-performers, both overall and in each of the three component categories, to raise the bar exponentially.
By redoubling their efforts they can harness extra savings for customers, minimize power disruptions even further,
and make the U.S. more resilient against a changing climate.
There is more research to be conducted on the precise socio-demographic characteristics that best explain utility
performance. In future reports we will examine those questions in further detail through econometric analyses. For
now we will highlight a few general observations and conclusions about the results contained in this report:
•
While some voices in both the energy industry and political circles have long sought to promote a belief that fossil
fuels contribute to lower electricity costs, the rankings in this report fail to corroborate that relationship. Instead,
states heavily dependent on coal-red electricity, such as West Virginia and Indiana, recorded below-average
affordability.
•
On the surface, at least, the connection between Advanced Metering Infrastructure (AMI) and reliability is not as
strong as one might assume. While states that have launched AMI upgrades, such as Nevada and Florida, do
comparatively well, states like Michigan, Oklahoma, and Ohio that have invested heavily in grid modernization
continue to lag in reliability performance. While likely a necessary condition for future improved resiliency, it
appears that smart grid infrastructure, by itself, is not enough to improve reliability.
•
It is noteworthy that many of the states with the lowest per unit power costs actually have some of the highest
average residential bills. Partly this is due to differences in weather, but energy efciency and other cost-effective
clean energy resources suppress power bills over time, particularly in restructured states. Consumers at the end of
the day pay bills, not rates, so analysis of any program or policy suite must examine the impact over time on energy
bills.
•
Finally, states that tend to be at the top of any one category are often high performers across the board. The same
pattern shows itself for states huddled along the bottom of any metric — they tend to do poorly across all metrics.
While it requires further investigation, this suggests an interrelated socio-policy landscape producing consistent
results.
In 2021, the United Nations’ Intergovernmental Panel on Climate Change declared that the U.S. and the globe were at
a crossroads in efforts to avert the most dire fallout from the carbon emissions unleashed by fossil fuels. That
warning has particularly formidable implications for American electricity production, which accounts for one quarter
of all U.S. carbon emissions, according to the U.S. Environmental Protection Agency (EPA). And it underscores why
the performance of our nation’s electric utilities warrants close and urgent attention.
As the country grapples with the challenge of transitioning to zero-carbon sources of electricity while also protecting
the affordability and reliability of electricity service, we hope that this report helps policymakers identify which states
are headed in the right direction and the policies that are propelling them there.

ELECTRIC UTILITY PERFORMANCE: A STATE-BY-STATE DATA REVIEW
3
TABLE 1: STATE RANKINGS ON OVERALL UTILITY PERFORMANCE
Ranking (Best to Worst) State Affordability Average Reliability Average Environmental Average Average Rank
1 Nevada 14.2 5.7 20.9 13.6
2 Washington 4.2 29.0 8.9 14.0
3 Idaho 6.6 24.2 13.8 14.9
4 Oregon 11.2 24.8 10.3 15.4
5 Illinois 17.2 7.7 22.4 15.8
6 Nebraska 15.6 7.5 29.0 17.4
7 North Dakota 20.2 8.7 26.2 18.4
8 Arizona 29.2 5.7 22.3 19.1
9 Minnesota 23.0 13.2 22.4 19.5
10 Utah 3.6 19.7 35.3 19.5
11 Colorado 13.4 18.2 27.4 19.7
12 District of Columbia 18.4 8.2 34.3 20.3
13 Iowa 26.3 13.0 21.6 20.3
14 Montana 18.4 22.2 22.6 21.1
15 New York 32.6 19.7 12.6 21.6
16 New Mexico 16.0 24.0 25.3 21.8
17 South Dakota 29.3 25.8 10.4 21.8
18 Florida 28.6 7.7 32.4 22.9
19 Kansas 28.2 25.8 15.4 23.1
20 New Jersey 28.8 18.2 23.2 23.4
21 Delaware 30.8 7.5 31.9 23.4
22 Wyoming 13.6 22.2 35.5 23.8
23 Oklahoma 16.4 38.8 16.7 24.0
24 California 25.8 31.5 16.0 24.4
25 Maryland 33.0 15.3 25.4 24.6
26 Tennessee 29.2 32.3 20.7 27.4
27 Wisconsin 23.0 27.2 32.6 27.6
28 South Carolina 34.9 29.2 18.9 27.7
29 Texas 27.4 28.5 27.2 27.7
30 Alabama 39.2 23.5 21.6 28.1
31 North Carolina 26.2 34.7 24.9 28.6
32 Georgia 34.9 21.5 29.6 28.7
33 Vermont 31.4 41.2 14.9 29.2
34 Pennsylvania 32.4 28.7 26.9 29.3
35 Rhode Island 41.8 17.8 28.9 29.5
36 New Hampshire 36.2 39.3 14.8 30.1
37 Missouri 24.8 25.8 40.3 30.3
38 Massachusetts 39.0 24.2 29.2 30.8
39 Arkansas 16.2 44.7 31.6 30.8
40 Kentucky 22.0 28.7 43.1 31.3
41 Virginia 31.8 39.3 26.9 32.7
42 Maine 32.8 47.5 17.8 32.7
43 Connecticut 46.2 31.3 20.8 32.8
44 Louisiana 18.6 45.0 37.9 33.8
45 Ohio 25.5 35.7 40.7 34.0
46 Michigan 30.6 44.2 31.1 35.3
47 Mississippi 30.4 44.2 31.8 35.5
48 Indiana 31.4 33.5 41.6 35.5
49 Hawaii 46.2 25.5 37.5 36.4
50 Alaska 42.6 38.7 31.4 37.6
51 West Virginia 26.7 50.0 41.1 39.3
Sources: EIA and U.S. Census Bureau

ELECTRIC UTILITY PERFORMANCE: A STATE-BY-STATE DATA REVIEW
4
Affordability Metrics
E
lectricity bills often have many components: xed monthly charges; a charge per kilowatt-hour (kWh) of
electricity; charges based on the customer’s peak rate of power usage in the billing month or previous year; and
others. The way utilities assign costs to these components of the bill varies among companies, classes of
customers and across states. Because, for customer purposes, each kWh is identical, dividing the total bill by the
kWh used is generally the best way to compare utility costs.
The Energy Information Administration (EIA) collects monthly data from each utility in each state on the amounts of
electricity sold and revenue from electricity by customer class. Customer classes include residential, commercial,
industrial and transportation, with almost all electricity delivered in most states going to the rst three classes. EIA
makes the data available through its Electricity Data Browser.
HOUSEHOLD ELECTRICITY COSTS AND EXPENDITURES
As one of the essentials of life, the cost of electricity is an existential matter for consumers. In the worst-case
scenario, it can force lower-income households to choose between keeping the refrigerator running and buying the
food that would go in it. And for industry, it is instrumental to staying competitive and promoting job growth.
The affordability of electricity is a nuanced calculation. For
households, climate and the availability of alternative heating
fuels can affect the amount of electricity they consume. While
this report focuses on electric costs (Figure 1 presents the
average monthly electric bill; Figure 4 the average annual cost
of electricity in dollars), it also recognizes the importance of
non-electricity expenditures for many states, and includes
those statistics in Figure 2. Also, expenditures on electricity
must be considered in the context of income — thus the metric
of energy expenditures as a percentage of state median
income (Figure 3) is an important measure of affordability.
Commercial and industrial users of electricity are less affected
by climate and heating fuels, so the technologies of commerce
and production can be more consistent from place to place.
However, different types of businesses have very different
energy requirements and often are clustered in different states
for reasons having little to do with energy costs. Thus, total commercial and industrial energy cost is not a good basis
for comparison; and in this case, a comparison of rates is more useful. After examining household expenditures and
residential electricity rates and costs, this report then looks at electricity rates for residential customers (Figure 5), as
well as for all customers: the residential, commercial, and industrial sectors combined (Figure 6).
This section shows that the prices of electricity and heating fuels are far from the only determining factor for overall
energy affordability. For example, whereas households in warmer climates may consume more electricity on an
annual basis to run air conditioning units than households in colder climates, those same households will not spend
as much on natural gas, propane or other heating fuels during the winter. Energy expenditures are measured by the
EIA in the State Energy Data System (SEDS) database at https://www.eia.gov/state/seds/. The explanation for high
costs in Alaska and Hawaii is simply their isolation relative to the U.S. mainland’s comparatively interconnected grid
and access to energy resources.
It’s interesting to note that some states — including Tennessee and Louisiana — that have some of the lowest electricity
rates in the country nonetheless have some of the higher overall bills. While a state’s per-kWh electricity rate must be
part of any analysis, it is wise to remember that customers pay bills, not rates, and nal conclusions about energy
affordability must include other metrics, such as average monthly and annual electric bill.

ELECTRIC UTILITY PERFORMANCE: A STATE-BY-STATE DATA REVIEW
5
TABLE 2: AFFORDABILITY RANKINGS (ALPHABETICAL)
State
Cost of Household
Energy Expenditures
Total Household
Electricity Costs as a
Percentage of Income
Electricity Cost
per Kilowatt-Hour
For All Customers
Electricity Cost per
Kilowatt-Hour for
Residential Customers
Annual Electricity
Expenditures
Alabama 38 50 29 30 49
Alaska 47 26 50 50 40
Arizona 13 34 35 25 39
Arkansas 8 41 4 5 23
California 12 8 47 46 16
Colorado 4 3 31 26 3
Connecticut 51 32 49 49 50
Delaware 35 25 34 31 29
District of Columbia 11 2 39 29 11
Florida 6 44 33 18 42
Georgia 37 46 27 21 43
Hawaii 41 37 51 51 51
Idaho 7 14 3 4 5
Illinois 19 7 23 33 4
Indiana 33 35 27 27 34
Iowa 32 28 17 34 20
Kansas 31 22 32 32 24
Kentucky 18 43 9 9 31
Louisiana 9 48 2 1 33
Maine 45 21 41 42 15
Maryland 42 10 37 35 41
Massachusetts 48 15 46 48 38
Michigan 36 23 40 41 13
Minnesota 24 6 36 37 12
Mississippi 25 51 15 14 47
Missouri 27 39 20 10 28
Montana 28 24 16 17 7
Nebraska 16 17 13 11 21
Nevada 10 19 8 15 19
New Hampshire 50 12 45 44 30
New Jersey 39 5 42 40 18
New Mexico 1 20 21 36 2
New York 44 16 43 43 17
North Carolina 14 42 22 16 37
North Dakota 30 27 12 6 26
Ohio 34 31 17 23 22
Oklahoma 15 38 1 3 25
Oregon 5 11 14 12 14
Pennsylvania 43 29 25 38 27
Rhode Island 46 33 48 47 35
South Carolina 26 47 26 27 48
South Dakota 29 36 30 19 32
Tennessee 21 49 24 8 44
Texas 20 40 10 22 45
Utah 2 1 7 7 1
Vermont 49 9 44 45 10
Virginia 40 30 19 24 46
Washington 3 4 6 2 6
West Virginia 22 45 11 19 36
Wisconsin 17 13 38 39 8
Wyoming 23 18 5 13 9
Source: EIA
AFFORDABILITY METRICS

ELECTRIC UTILITY PERFORMANCE: A STATE-BY-STATE DATA REVIEW
6
TABLE 3: AFFORDABILITY RANKINGS (BEST-TO-WORST)
Rank Based
on Average
Performance State
Cost of Household
Energy Expenditures
Total Household
Electricity Costs
as a Percentage of
Income
Electricity Cost
per Kilowatt-Hour
For All Customers
Electricity Cost per
Kilowatt-Hour for
Residential Customers
Annual Electricity
Expenditures
1 Utah 2 1 7 7 1
2 Washington 3 4 6 2 6
3 Idaho 7 14 3 4 5
4 Oregon 5 11 14 12 14
5 Colorado 4 3 31 26 3
6 Wyoming 23 18 5 13 9
7 Nevada 10 19 8 15 19
8 Nebraska 16 17 13 11 21
9 New Mexico 1 20 21 36 2
10 Arkansas 8 41 4 5 23
11 Oklahoma 15 38 1 3 25
12 Illinois 19 7 23 33 4
13 District of Columbia 11 2 39 29 11
13 Montana 28 24 16 17 7
15 Louisiana 9 48 2 1 33
16 North Dakota 30 27 12 6 26
17 Kentucky 18 43 9 9 31
18 Minnesota 24 6 36 37 12
18 Wisconsin 17 13 38 39 8
20 Missouri 27 39 20 10 28
21 Ohio 34 31 17 23 22
22 California 12 8 47 46 16
23 North Carolina 14 42 22 16 37
24 Iowa 32 28 17 34 20
25 West Virginia 22 45 11 19 36
26 Texas 20 40 10 22 45
27 Kansas 31 22 32 32 24
28 Florida 6 44 33 18 42
29 New Jersey 39 5 42 40 18
30 Arizona 13 34 35 25 39
30 Tennessee 21 49 24 8 44
32 South Dakota 29 36 30 19 32
33 Mississippi 25 51 15 14 47
34 Michigan 36 23 40 41 13
35 Delaware 35 25 34 31 29
36 Vermont 49 9 44 45 10
36 Indiana 33 35 27 27 34
38 Virginia 40 30 19 24 46
39 Pennsylvania 43 29 25 38 27
40 New York 44 16 43 43 17
41 Maine 45 21 41 42 15
42 Maryland 42 10 37 35 41
43 South Carolina 26 47 26 27 48
43 Georgia 37 46 27 21 43
45 New Hampshire 50 12 45 44 30
46 Massachusetts 48 15 46 48 38
47 Alabama 38 50 29 30 49
48 Rhode Island 46 33 48 47 35
49 Alaska 47 26 50 50 40
50 Connecticut 51 32 49 49 50
50 Hawaii 41 37 51 51 51
Source: EIA
AFFORDABILITY METRICS

ELECTRIC UTILITY PERFORMANCE: A STATE-BY-STATE DATA REVIEW
7
FIGURE 1: 2019 AVERAGE MONTHLY COST OF ELECTRICITY BILLS
State
Yearly Residential Electricity Sales
per Customer in Kilowatt Hours
Residential Electricity Price in
Dollars per Kilowatt Hour
Average Residential Monthly
Electricity Bill
Utah 8,726 $0.10 $76
New Mexico 7,677 $0.13 $80
Colorado 8,187 $0.12 $83
Illinois 8,509 $0.13 $92
Idaho 11,386 $0.10 $94
Washington 11,680 $0.10 $95
Montana 10,286 $0.11 $95
Wisconsin 8,086 $0.14 $96
Wyoming 10,366 $0.11 $97
Vermont 6,583 $0.18 $97
District of Columbia 9,023 $0.13 $98
Minnesota 9,112 $0.13 $99
Michigan 7,640 $0.16 $100
Oregon 10,935 $0.11 $100
Maine 6,744 $0.18 $101
California 6,385 $0.19 $102
New York 6,930 $0.18 $104
New Jersey 7,955 $0.16 $105
Nevada 10,679 $0.12 $107
Iowa 10,406 $0.12 $108
Nebraska 12,047 $0.11 $108
Ohio 10,485 $0.12 $108
Arkansas 13,410 $0.10 $110
Kansas 10,691 $0.13 $113
Oklahoma 13,396 $0.10 $114
North Dakota 13,311 $0.10 $114
Pennsylvania 10,038 $0.14 $115
Missouri 12,693 $0.11 $118
Delaware 11,395 $0.13 $119
New Hampshire 7,185 $0.20 $120
Kentucky 13,346 $0.11 $120
South Dakota 12,526 $0.12 $121
Indiana 11,517 $0.13 $121
Louisiana 14,787 $0.10 $121
Rhode Island 6,715 $0.22 $122
West Virginia 13,004 $0.11 $122
North Carolina 12,953 $0.11 $123
Massachusetts 6,893 $0.22 $126
Arizona 12,169 $0.12 $126
Alaska 6,665 $0.23 $127
Maryland 11,704 $0.13 $128
Florida 13,295 $0.12 $130
Georgia 13,449 $0.12 $132
Tennessee 14,605 $0.11 $132
Texas 13,679 $0.12 $134
Virginia 13,469 $0.12 $135
Mississippi 14,472 $0.11 $136
South Carolina 13,368 $0.13 $145
Alabama 14,411 $0.13 $150
Connecticut 8,269 $0.22 $151
Hawaii 6,296 $0.32 $168
Source: EIA
AFFORDABILITY METRICS

ELECTRIC UTILITY PERFORMANCE: A STATE-BY-STATE DATA REVIEW
8
FIGURE 2: 2019 AVERAGE ANNUAL COST OF HOUSEHOLD ENERGY EXPENDITURES
■ Electricity Expenditures ■ Non-Electricity Energy Expenditures ■ Total Expenditures
$1,809
$1,441
$1,166
$1,511
$1,528
$1,459
$1,206
$1,243
$1,386
$1,535
$2,018
$1,626
$1,261
$1,805
$1,582
$1,203
$1,430
$1,298
$1,449
$1,296
$1,359
$1,371
$1,447
$1,145
$1,414
$1,737
$1,630
$1,188
$1,158
$1,463
$1,588
$1,609
$1,108
$1,441
$1,146
$1,297
$1,367
$1,479
$1,513
$1,223
$1,172
$1,282
$1,448
$1,314
$1,126
$1,556
$1,204
$997
$1,134
$908
$960
$1,365
$1,500
$1,734
$1,368
$1,280
$1,346
$1,378
$1,254
$909
$634
$108
$473
$832
$280
$473
$838
$603
$709
$550
$692
$622
$608
$531
$828
$547
$223
$304
$737
$764
$456
$289
$261
$755
$385
$674
$522
$449
$326
$261
$501
$552
$439
$223
$349
$531
$62
$408
$613
$437
$613
$501
$0 $500 $1,000 $1,500 $2,000 $2,500 $3,000 $3,500
Connecticut
New Hampshire
Vermont
Massachusetts
Alaska
Rhode Island
Maine
New York
Pennsylvania
Maryland
Hawaii
Virginia
New Jersey
Alabama
Georgia
Michigan
Delaware
Ohio
Indiana
Iowa
Kansas
North Dakota
South Dakota
Montana
Missouri
South Carolina
Mississippi
Minnesota
Wyoming
West Virginia
Tennessee
Texas
Illinois
Kentucky
Wisconsin
Nebraska
Oklahoma
North Carolina
Arizona
California
District of Columbia
Nevada
Louisiana
Arkansas
Idaho
Florida
Oregon
Colora
do
Washington
Utah
New Mexico
$1,461
$1,521
$1,571
$1,610
$1,612
$1,618
$1,657
$1,663
$1,671
$1,721
$1,724
$1,724
$1,774
$1,805
$1,816
$1,819
$1,820
$1,826
$1,863
$1,870
$1,877
$1,919
$1,922
$1,925
$1,934
$1,960
$1,961
$1,973
$1,978
$1,979
$1,981
$1,988
$1,999
$2,007
$2,033
$2,041
$2,055
$2,085
$2,093
$2,099
$2,126
$2,169
$2,295
$2,497
$2,584
$2,805
$2,808
$2,879
$2,900
$2,941
$3,174
Source: EIA
AFFORDABILITY METRICS

ELECTRIC UTILITY PERFORMANCE: A STATE-BY-STATE DATA REVIEW
9
FIGURE 3: 2019 AVERAGE ANNUAL HOUSEHOLD ELECTRICITY COSTS
AS A PERCENTAGE OF MEDIAN INCOME
3.64%
3.21%
2.80%
2.80%
2.80%
2.79%
2.72%
2.67%
2.59%
2.42%
2.41%
2.39%
2.33%
2.30%
2.29%
2.25%
2.17%
2.14%
2.08%
2.07%
2.01%
2.00%
1.96%
1.96%
1.96%
1.95%
1.93%
1.90%
1.88%
1.86%
1.81%
1.81%
1.81%
1.78%
1.77%
1.73%
1.72 %
1.71%
1.70%
1.66%
1.62%
1.61%
1.57%
1.57%
1.49%
1.46%
1.44%
1.38%
1.37%
1.26%
1.07%
0.0%0.5%1.0%1.5%2.0%2.5% 3.0%3.5%4.0%
Mississippi
Alabama
Tennessee
Louisiana
South Carolina
Georgia
West Virginia
Florida
Kentucky
North Carolina
Arkansas
Texas
Missouri
Oklahoma
Hawaii
South Dakota
Indiana
Arizona
Rhode Island
Connecticut
Ohio
Virginia
Pennsylvania
Iowa
North Dakota
Alaska
Delaware
Montana
Michigan
Kansas
Maine
New Mexico
Nevada
Wyoming
Nebraska
New York
Massachusetts
Idaho
Wisconsin
New Hampshire
Oregon
Maryland
Vermont
California
Illinois
Minnesota
New Jersey
Washington
Colorado
District of Columbia
Utah
Source: EIA and U.S. Census Bureau
AFFORDABILITY METRICS

ELECTRIC UTILITY PERFORMANCE: A STATE-BY-STATE DATA REVIEW
10
FIGURE 4: 2019 AVERAGE ANNUAL RESIDENTIAL ELECTRICITY EXPENDITURES
$2,018
$1,809
$1,805
$1,737
$1,630
$1,626
$1,609
$1,588
$1,582
$1,556
$1,535
$1,528
$1,513
$1,511
$1,479
$1,463
$1,459
$1,449
$1,448
$1,447
$1,441
$1,441
$1,430
$1,414
$1,386
$1,371
$1,367
$1,359
$1,314
$1,298
$1,297
$1,296
$1,282
$1,261
$1,243
$1,223
$1,206
$1,204
$1,203
$1,188
$1,172
$1,166
$1,158
$1,146
$1,145
$1,134
$1,126
$1,108
$997
$960
$908
$0 $500 $1,000 $1,500 $2,000 $2,500
Hawaii
Connecticut
Alabama
South Carolina
Mississippi
Virginia
Texas
Tennessee
Georgia
Florida
Maryland
Alaska
Arizona
Massachusetts
North Carolina
West Virginia
Rhode Island
Indiana
Louisiana
South Dakota
Kentucky
New Hampshire
Delaware
Missouri
Pennsylvania
North Dakota
Oklahoma
Kansas
Arkansas
Ohio
Nebraska
Iowa
Nevada
New Jersey
New York
California
Maine
Oregon
Michigan
Minnesota
District of Columbia
Vermont
Wyoming
Wisconsin
Montana
Washington
Idaho
Illinois
Colorado
New Mexico
Utah
Source: EIA
AFFORDABILITY METRICS

ELECTRIC UTILITY PERFORMANCE: A STATE-BY-STATE DATA REVIEW
11
FIGURE 5: 2020 AVERAGE ANNUAL ELECTRICTY COST PER KILOWATT-HOUR
FOR RESIDENTIAL CUSTOMERS
$0.30
$0.23
$0.22
$0.22
$0.22
$0.21
$0.19
$0.19
$0.18
$0.17
$0.16
$0.16
$0.15
$0.14
$0.13
$0.13
$0.13
$0.13
$0.13
$0.13
$0.13
$0.13
$0.13
$0.13
$0.13
$0.12
$0.12
$0.12
$0.12
$0.12
$0.12
$0.12
$0.12
$0.12
$0.12
$0.12
$0.11
$0.11
$0.11
$0.11
$0.11
$0.11
$0.11
$0.11
$0.11
$0.10
$0.10
$0.10
$0.10
$0.10
$0.09
$0.00$0.05$0.10 $0.15 $0.20$0.25 $0.30$0.35
Hawaii
Alaska
Connecticut
Massachusetts
Rhode Island
California
Vermont
New Hampshire
New York
Maine
Michigan
New Jersey
Wisconsin
Pennsylvania
Minnesota
New Mexico
Maryland
Iowa
Illinois
Kansas
Delaware
Alabama
District of Columbia
South Carolina
Indiana
Colorado
Arizona
Virginia
Ohio
Texas
Georgia
South Dakota
West Virginia
Florida
Montana
North Carolina
Nevada
Mississippi
Wyoming
Oregon
Nebraska
Missouri
Kentucky
Tennessee
Utah
North Dakota
Arkansas
Idaho
Oklahoma
Washington
Louisiana
Source: EIA
AFFORDABILITY METRICS

ELECTRIC UTILITY PERFORMANCE: A STATE-BY-STATE DATA REVIEW
12
FIGURE 6: 2020 AVERAGE ANNUAL ELECTRICITY COST PER KILOWATT-HOUR
FOR ALL CUSTOMERS (RESIDENTIAL, COMMERCIAL, INDUSTRIAL)
$0.28
$0.20
$0.19
$0.19
$0.18
$0.18
$0.17
$0.16
$0.15
$0.14
$0.14
$0.12
$0.12
$0.11
$0.11
$0.11
$0.11
$0.10
$0.10
$0.10
$0.10
$0.10
$0.10
$0.10
$0.10
$0.10
$0.10
$0.10
$0.10
$0.10
$0.09
$0.09
$0.09
$0.09
$0.09
$0.09
$0.09
$0.09
$0.09
$0.09
$0.09
$0.09
$0.09
$0.08
$0.08
$0.08
$0.08
$0.08
$0.08
$0.08
$0.07
$0.05 $0.00 $0.10 $0.15 $0.20 $0.25 $0.30
Hawaii
Alaska
Connecticut
Rhode Island
California
Massachusetts
New Hampshire
Vermont
New York
New Jersey
Maine
Michigan
District of Columbia
Wisconsin
Maryland
Minnesota
Arizona
Delaware
Florida
Kansas
Colorado
South Dakota
Alabama
Georgia
Indiana
South Carolina
Pennsylvania
Tennessee
Illinois
North Carolina
New Mexico
Missouri
Virginia
Iowa
Ohio
Montana
Mississippi
Oregon
Nebraska
North Dakota
West Virginia
Texas
Kentucky
Nevada
Utah
Washington
Wyoming
Arkansas
Idaho
Louisiana
Oklahoma
Source: EIA
AFFORDABILITY METRICS

ELECTRIC UTILITY PERFORMANCE: A STATE-BY-STATE DATA REVIEW
13
Utility Reliability and Performance Metrics
Electricity is a universal need. It protects us from hazardous
weather, fends off the darkness, and propels our economy.
Without it, contemporary life would be virtually uninhabitable.
So providing reliable electricity service is one of the foremost
responsibilities we entrust to utilities and a critical bellwether
of their performance.
Much of the public discussion about electric utility reliability
focuses on what regulators and utilities call “Resource
Adequacy.” This ensures there is sufcient power generation
capacity to satisfy each utility’s peak customer demand.
However, loss of electricity supply due to generation or
transmission problems accounts for only about 1% of outage
minutes nationally. Power outages that utility customers
experience on a regular basis are not caused by insufcient
generation capacity or long-distance transmission, but by
breakdowns in the electricity delivery system—the distribution grid. Such disruptions happen for many reasons,
including power lines downed by the violent weather that has become more common as climate change intensies;
animals that disturb lines and cause a “short;” and equipment failures.
The electric power industry, led by the Institute of Electrical and Electronics Engineers (IEEE), has determined that the
best overall measure of an electric utility’s reliability is the average number of minutes of outages per year per
customer, calculated by a method referred to as the System Average Interruption Duration Index (SAIDI).
SAIDI (Figures 7 and 8) is a primary metric for electric reliability, but it is the product of two other reliability metrics.
The Customer Average Interruption Duration Index (CAIDI), Figures 9 and 10, measures the average time for the utility
to restore power to a customer after an outage starts. The System Average Interruption Frequency Index (SAIFI),
displayed in Figures 11 and 12, measures outages per customer.
These metrics are interrelated. Poor SAIDI scores can be driven by SAIFI or CAIDI, or both. For example, the relatively
high SAIDI scores for California and Michigan are driven more by CAIDI (long outages) than by SAIFI (frequent
outages). The reverse is true of Louisiana and Mississippi.
Beginning in 2013, the EIA began collecting annual reports of SAIDI, SAIFI and CAIDI from utilities and publishing
the data in annual compilations. The information is collected on form EIA-861 and may be downloaded at the EIA
website. The latest available reliability data from EIA are for calendar year 2019.
The EIA collects SAIDI and SAIFI metrics with and without Major Event Days (MED). MED are often the result of ice storms,
windstorms, wildres, and hurricanes, and can materially affect annual reliability statistics. While reliability metrics that
include MED can uctuate greatly year-to-year, they provide a more accurate representation of customer experience in a
given year than metrics excluding MED. For this reason, reliability data are presented with and without MED.
When looking at the gures in this report, it is worth understanding the statistical classication of MED: IEEE denes
it as any day on which more than 10% of utility customers are without power. The result of this hard threshold is that
sometimes reliability scores without MED may, in fact, be driven by major events. For example, in the case of storm
recovery that lasts multiple days, the time toward the beginning of that recovery may be considered MED because
more than 10% of utility customers are without power. However, the time near the end may not be considered MED
because fewer than 10% of customers are without power — even though all the days of the outage were caused by
the same event.
We computed SAIDI, SAIFI and CAIDI with and without MED by state using an average of the reporting utilities within
each state, weighted by the number of customers served by each utility.

ELECTRIC UTILITY PERFORMANCE: A STATE-BY-STATE DATA REVIEW
14
TABLE 4: RELIABILITY RANKINGS (ALPHABETICAL)
Average Duration of Power Outages Average Time to Restore Power Per Customer Average Frequency of Power Outages
State
With Major
Event Days (SAIDI)
Without Major
Event Days (SAIDI)
With Major
Event Days (CAIDI)
Without Major
Event Days (CAIDI)
With Major
Event Days (SAIFI)
Without Major
Event Days (SAIFI)
Alabama 19 27 12 24 30 29
Alaska 33 43 22 39 49 46
Arizona 3 3 2 12 6 8
Arkansas 44 49 41 46 43 45
California 49 19 51 32 23 15
Colorado 20 12 29 20 15 13
Connecticut 23 44 46 51 8 16
Delaware 6 6 6 4 9 14
District of Columbia 1 1 19 26 1 1
Florida 5 7 1 2 13 18
Georgia 13 31 5 14 28 38
Hawaii 21 24 9 17 45 37
Idaho 15 35 13 27 22 33
Illinois 8 5 11 9 7 6
Indiana 30 38 26 35 36 36
Iowa 9 14 7 11 16 21
Kansas 25 26 30 21 27 26
Kentucky 22 39 10 18 40 43
Louisiana 46 45 43 40 48 48
Maine 51 47 50 38 50 49
Maryland 10 15 17 19 14 17
Massachusetts 28 17 39 28 21 12
Michigan 48 46 49 49 38 35
Minnesota 12 11 20 16 10 10
Mississippi 47 50 38 37 46 47
Missouri 29 23 31 25 24 23
Montana 16 29 8 15 26 39
Nebraska 2 2 14 23 2 2
Nevada 4 9 3 8 3 7
New Hampshire 36 48 33 48 31 40
New Jersey 26 13 28 3 19 20
New Mexico 17 33 18 29 20 27
New York 18 10 35 47 5 3
North Carolina 34 36 34 42 32 30
North Dakota 7 8 16 6 4 11
Ohio 39 37 37 36 33 32
Oklahoma 42 34 45 41 37 34
Oregon 31 18 40 45 11 4
Pennsylvania 27 30 32 33 25 25
Rhode Island 24 4 25 1 29 24
South Carolina 41 20 36 22 34 22
South Dakota 37 22 24 5 39 28
Tennessee 32 40 15 10 47 50
Texas 35 28 23 13 41 31
Utah 11 25 21 30 12 19
Vermont 45 41 42 31 44 44
Virginia 40 42 27 43 42 42
Washington 38 21 44 44 18 9
West Virginia 50 51 47 50 51 51
Wisconsin 43 16 48 34 17 5
Wyoming 14 32 4 7 35 41
Source: EIA
UTILITY RELIABILITY AND PERFORMANCE METRICS

ELECTRIC UTILITY PERFORMANCE: A STATE-BY-STATE DATA REVIEW
15
TABLE 5: RELIABILITY RANKINGS (BEST-TO-WORST)
Rank Based
on Average
Performance
Average Duration
of Power Outages
Average Time to Restore Power
Per Customer
Average Frequency
of Power Outages
State
With Major
Event Days (SAIDI)
Without Major
Event Days (SAIDI)
With Major
Event Days (CAIDI)
Without Major
Event Days (CAIDI)
With Major
Event Days (SAIFI)
Without Major
Event Days (SAIFI)
1 Nevada 4 9 3 8 3 7
1 Arizona 3 3 2 12 6 8
3 Nebraska 2 2 14 23 2 2
3 Delaware 6 6 6 4 9 14
5 Illinois 8 5 11 9 7 6
5 Florida 5 7 1 2 13 18
7 District of Columbia 1 1 19 26 1 1
8 North Dakota 7 8 16 6 4 11
9 Iowa 9 14 7 11 16 21
10 Minnesota 12 11 20 16 10 10
11 Maryland 10 15 17 19 14 17
12 Rhode Island 24 4 25 1 29 24
13 Colorado 20 12 29 20 15 13
13 New Jersey 26 13 28 3 19 20
15 Utah 11 25 21 30 12 19
15 New York 18 10 35 47 5 3
17 Georgia 13 31 5 14 28 38
18 Montana 16 29 8 15 26 39
18 Wyoming 14 32 4 7 35 41
20 Alabama 19 27 12 24 30 29
21 New Mexico 17 33 18 29 20 27
22 Idaho 15 35 13 27 22 33
22 Massachusetts 28 17 39 28 21 12
24 Oregon 31 18 40 45 11 4
25 Hawaii 21 24 9 17 45 37
27 South Dakota 37 22 24 5 39 28
27 Kansas 25 26 30 21 27 26
27 Missouri 29 23 31 25 24 23
29 Wisconsin 43 16 48 34 17 5
30 Texas 35 28 23 13 41 31
31 Pennsylvania 27 30 32 33 25 25
31 Kentucky 22 39 10 18 40 43
33 Washington 38 21 44 44 18 9
34 South Carolina 41 20 36 22 34 22
35 Connecticut 23 44 46 51 8 16
36 California 49 19 51 32 23 15
37 Tennessee 32 40 15 10 47 50
38 Indiana 30 38 26 35 36 36
39 North Carolina 34 36 34 42 32 30
40 Ohio 39 37 37 36 33 32
41 Alaska 33 43 22 39 49 46
42 Oklahoma 42 34 45 41 37 34
43 New Hampshire 36 48 33 48 31 40
43 Virginia 40 42 27 43 42 42
45 Vermont 45 41 42 31 44 44
46 Michigan 48 46 49 49 38 35
46 Mississippi 47 50 38 37 46 47
48 Arkansas 44 49 41 46 43 45
49 Louisiana 46 45 43 40 48 48
50 Maine 51 47 50 38 50 49
51 West Virginia 50 51 47 50 51 51
Source: EIA
UTILITY RELIABILITY AND PERFORMANCE METRICS

ELECTRIC UTILITY PERFORMANCE: A STATE-BY-STATE DATA REVIEW
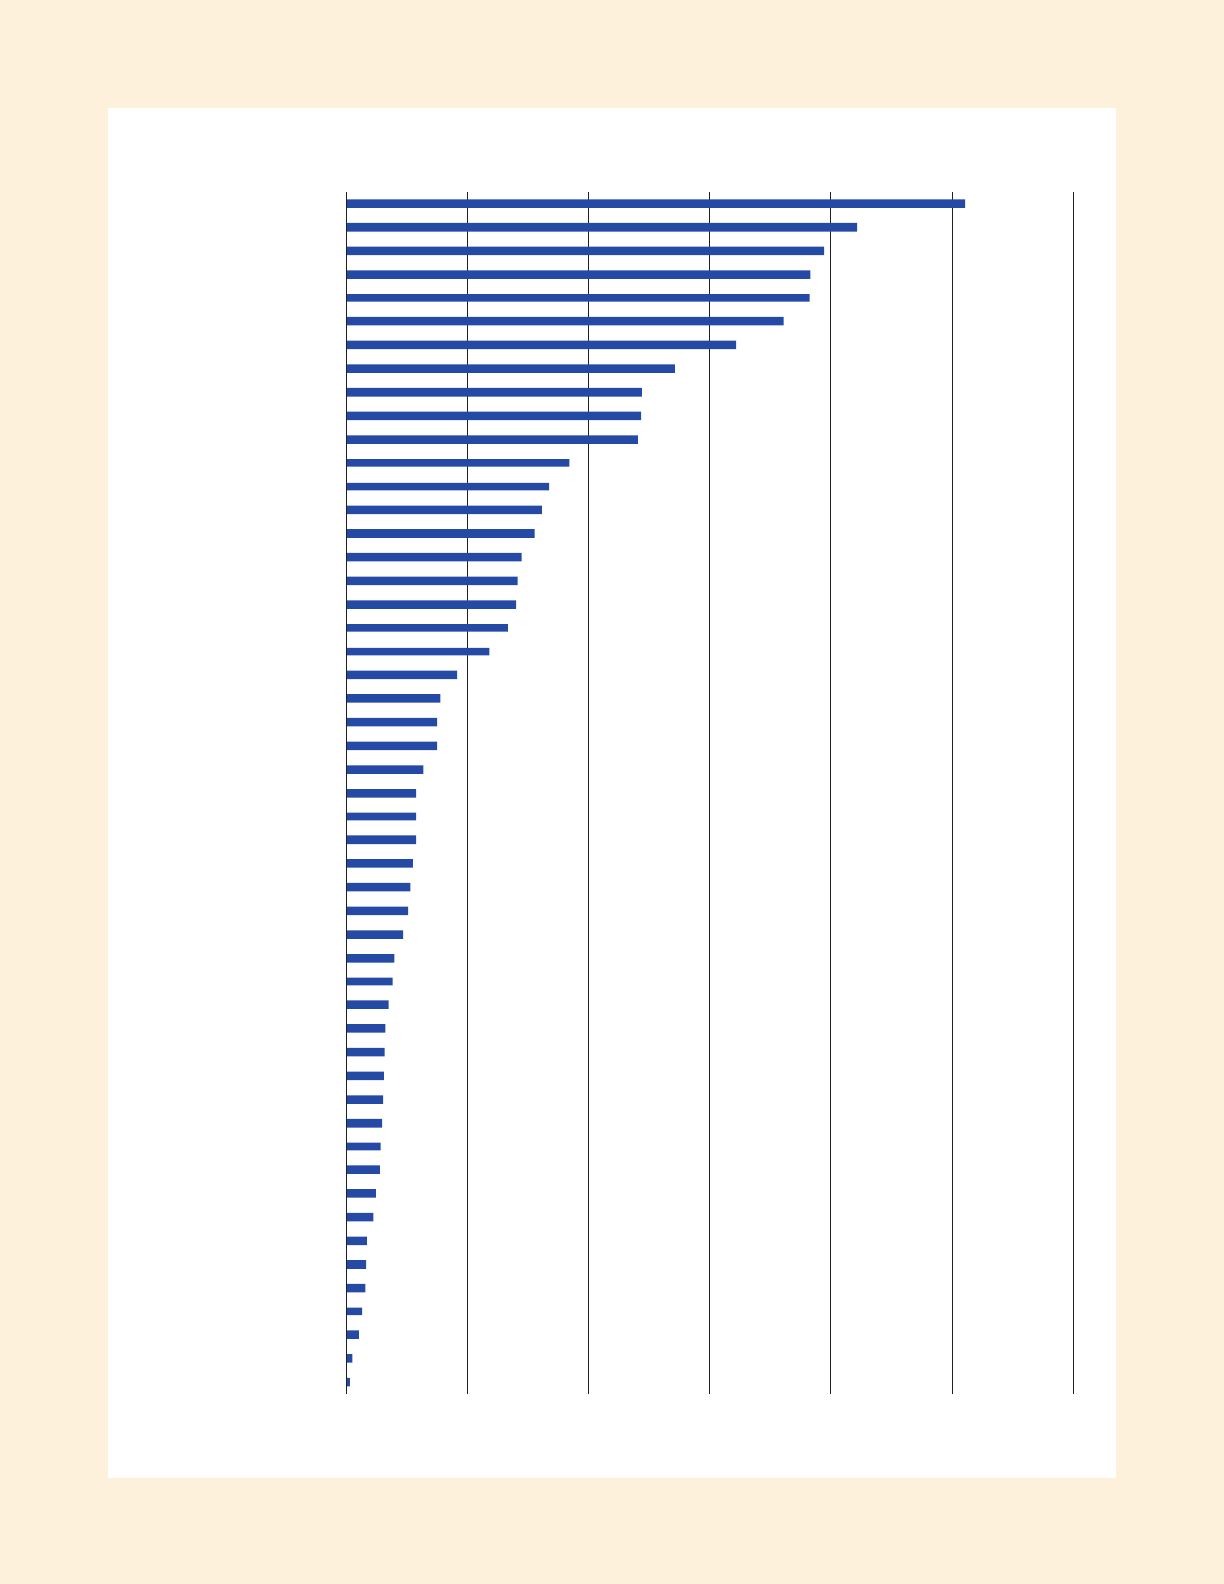
16
FIGURE 7: AVERAGE DURATION OF POWER OUTAGES PER YEAR PER CUSTOMER, IN MINUTES (SAIDI)
WITH MAJOR EVENT DAYS
0 100 200 300 400 500 600 700 800 900 1,000
Maine
West Virginia
California
Michigan
Mississippi
Louisiana
Vermont
Arkansas
Wisconsin
Oklahoma
South Carolina
Virginia
Ohio
Washington
South Dakota
New Hampshire
Texas
North Carolina
Alaska
Tennessee
Oregon
Indiana
Missouri
Massachusetts
Pennsylvania
New Jersey
Kansas
Rhode Island
Connecticut
Kentucky
Hawaii
Colorado
Alabama
New York
New Mexico
Montana
Idaho
Wyoming
Georgia
Minnesota
Utah
Maryland
Iowa
Illinois
North Dakota
Delaware
Florida
Nevada
Arizona
Nebraska
District of Columbia
77
84
86
87
88
102
107
116
123
141
146
150
152
164
167
169
170
171
174
181
195
203
236
236
240
248
249
250
255
261
265
267
280
288
291
292
295
300
305
310
327
335
356
438
444
472
519
555
587
755
908
Source: EIA
UTILITY RELIABILITY AND PERFORMANCE METRICS

ELECTRIC UTILITY PERFORMANCE: A STATE-BY-STATE DATA REVIEW
17
FIGURE 8: AVERAGE DURATION OF POWER OUTAGES PER YEAR PER CUSTOMER, IN MINUTES (SAIDI)
WITHOUT MAJOR EVENT DAYS
0 50 100 150 200 250 300 350 400 450 500
West Virginia
Mississippi
Arkansas
New Hampshire
Maine
Michigan
Louisiana
Connecticut
Alaska
Virginia
Vermont
Tennessee
Kentucky
Indiana
Ohio
North Carolina
Idaho
Oklahoma
New Mexico
Wyoming
Georgia
Pennsylvania
Montana
Texas
Alabama
Kansas
Utah
Hawaii
Missouri
South Dakota
Washington
South Carolina
California
Oregon
Massachusetts
Wisconsin
Maryland
Iowa
New Jersey
Colorado
Minnesota
New York
Nevada
North Dakota
Florida
Delaware
Illinois
Rhode Island
Arizona
Nebraska
District of Columbia
55
62
67
68
74
74
74
74
77
79
81
84
87
90
91
93
96
104
104
106
106
107
113
113
115
117
120
122
127
128
128
130
132
139
144
146
146
147
149
161
170
182
184
200
208
211
214
217
222
222
471
Source: EIA
UTILITY RELIABILITY AND PERFORMANCE METRICS

ELECTRIC UTILITY PERFORMANCE: A STATE-BY-STATE DATA REVIEW
18
FIGURE 9: AVERAGE AMOUNT OF TIME TO RESTORE POWER PER CUSTOMER, IN MINUTES (CAIDI)
WITH MAJOR EVENT DAYS
0 50 100 150 200 250 300 350 400
California
Maine
Michigan
Wisconsin
West Virginia
Connecticut
Oklahoma
Washington
Louisiana
Vermont
Arkansas
Oregon
Massachusetts
Mississippi
Ohio
South Carolina
New York
North Carolina
New Hampshire
Pennsylvania
Missouri
Kansas
Colorado
New Jersey
Virginia
Indiana
Rhode Island
South Dakota
Texas
Alaska
Utah
Minnesota
District of Columbia
New Mexico
Maryland
North Dakota
Tennessee
Nebraska
Idaho
Alabama
Illinois
Kentucky
Hawaii
Montana
Iowa
Delaware
Georgia
Wyoming
Nevada
Arizona
Florida
85
92
97
103
105
109
11 4
11 4
116
118
122
122
123
123
123
124
127
129
131
134
137
138
159
165
169
171
172
172
175
182
189
189
194
195
197
204
206
208
208
213
220
220
223
232
240
243
275
285
356
366
371
Source: EIA
UTILITY RELIABILITY AND PERFORMANCE METRICS

ELECTRIC UTILITY PERFORMANCE: A STATE-BY-STATE DATA REVIEW
19
UTILITY RELIABILITY AND PERFORMANCE METRICS
FIGURE 10: AVERAGE AMOUNT OF TIME TO RESTORE POWER PER CUSTOMER, IN MINUTES (CAIDI)
WITHOUT MAJOR EVENT DAYS
0 50 100 150 200 250
Connecticut
West Virginia
Michigan
New Hampshire
New York
Arkansas
Oregon
Washington
Virginia
North Carolina
Oklahoma
Louisiana
Alaska
Maine
Mississippi
Ohio
Indiana
Wisconsin
Pennsylvania
California
Vermont
Utah
New Mexico
Massachusetts
Idaho
District of Columbia
Missouri
Alabama
Nebraska
South Carolina
Kansas
Colorado
Maryland
Kentucky
Hawaii
Minnesota
Montana
Georgia
Texas
Arizona
Iowa
Tennessee
Illinois
Nevada
Wyoming
North Dakota
South Dakota
Delaware
New Jersey
Florida
Rhode Island
67
81
85
90
91
91
93
93
93
94
95
95
98
99
99
99
99
100
101
101
101
103
106
106
108
112
112
11 4
115
115
116
118
121
122
123
124
129
129
129
131
131
131
131
133
139
144
145
173
182
196
211
Source: EIA

ELECTRIC UTILITY PERFORMANCE: A STATE-BY-STATE DATA REVIEW
20
UTILITY RELIABILITY AND PERFORMANCE METRICS
FIGURE 11: AVERAGE FREQUENCY OF POWER OUTAGES PER CUSTOMER, IN NUMBER OF OUTAGES (SAIFI)
WITH MAJOR EVENT DAYS
0 0.5 1.0 1.5 2.0 2.5 3.0
West Virginia
Maine
Alaska
Louisiana
Tennessee
Mississippi
Hawaii
Vermont
Arkansas
Virginia
Texas
Kentucky
South Dakota
Michigan
Oklahoma
Indiana
Wyoming
South Carolina
Ohio
North Carolina
New Hampshire
Alabama
Rhode Island
Georgia
Kansas
Montana
Pennsylvania
Missouri
California
Idaho
Massachusetts
New Mexico
New Jersey
Washington
Wisconsin
Iowa
Colorado
Maryland
Florida
Utah
Oregon
Minnesota
Delaware
Connecticut
Illinois
Arizona
New York
North Dakota
Nevada
Nebraska
District of Columbia
0.6
0.7
0.8
0.9
0.9
0.9
0.9
1.0
1.0
1.0
1.0
1.0
1.0
1.0
1.1
1.1
1.1
1.2
1.2
1.2
1.2
1.2
1.3
1.3
1.3
1.3
1.4
1.4
1.4
1.4
1.4
1.4
1.5
1.5
1.5
1.5
1.5
1.5
1.6
1.6
1.7
1.7
1.9
2.0
2.1
2.1
2.2
2.2
2.2
2.5
2.8
Source: EIA
UTILITY RELIABILITY AND PERFORMANCE METRICS

ELECTRIC UTILITY PERFORMANCE: A STATE-BY-STATE DATA REVIEW
21
FIGURE 12: AVERAGE FREQUENCY OF POWER OUTAGES PER CUSTOMER, IN NUMBER OF OUTAGES (SAIFI)
WITHOUT MAJOR EVENT DAYS
O 0.5 1.0 1.5 2.0 2.5
West Virginia
Tennessee
Maine
Louisiana
Mississippi
Alaska
Arkansas
Vermont
Kentucky
Virginia
Wyoming
New Hampshire
Montana
Georgia
Hawaii
Indiana
Michigan
Oklahoma
Idaho
Ohio
Texas
North Carolina
Alabama
South Dakota
New Mexico
Kansas
Pennsylvania
Rhode Island
Missouri
South Carolina
Iowa
New Jersey
Utah
Florida
Maryland
Connecticut
California
Delaware
Colorado
Massachusetts
North Dakota
Minnesota
Washington
Arizona
Nevada
Illinois
Wisconsin
Oregon
New York
Nebraska
District of Columbia
0.5
0.5
0.6
0.7
0.8
0.8
0.8
0.8
0.8
0.8
0.8
0.8
0.9
0.9
0.9
0.9
0.9
0.9
0.9
0.9
0.9
1.0
1.0
1.0
1.0
1.0
1.1
1.1
1.1
1.1
1.1
1.1
1.1
1.1
1.2
1.2
1.2
1.2
1.2
1.2
1.3
1.3
1.4
1.5
1.5
1.6
1.6
1.7
1.7
1.8
2.4
Source: EIA
UTILITY RELIABILITY AND PERFORMANCE METRICS

ELECTRIC UTILITY PERFORMANCE: A STATE-BY-STATE DATA REVIEW
22
Environmental Metrics
This section of the report compares states by the sources of electricity that power them, and it ranks states
according to the emissions of key pollutants by power plants. The data come from the EIA’s State Energy Data
System (SEDS) database as well as state electricity proles.
Electric utilities report emissions of key pollutants from each power plant to the Environmental Protection Agency
(EPA), which compiles this information and makes it available to the EIA. 2019 is the most recent data available.
ELECTRICITY SOURCES
The electricity grid interconnects states and generation resources such that at any given time customers cannot
know precisely where their electricity is coming from. For example, the power could originate at an in-state windfarm
or at a coal plant across state lines.
Figures 13 through 18 show each state’s renewable and clean generation, in terawatt-hours, and the states’ clean and
renewable generation and imports as a percentage of electricity sales. In this report, renewable resources are dened
as: hydroelectric, utility-scale solar, wind, geothermal and biomass. The denition of clean resources, meanwhile,
includes all renewable resources, except for biomass, and with the addition of nuclear. While Biomass is considered a
renewable resource (it comprises a variety of organic sources that can be regrown and is technically net-zero
emissions), it is not considered a clean resource. That is because it produces substantial emissions when burned,
which may contaminate the atmosphere at the site of burning.
Some states with largely clean and renewable generation mixes import electricity generated with fossil fuels from out
of state to meet their energy demands. This is the case for Idaho, which has a 79% renewable generation mix, but
renewable generation is only 54% (Figure 17) of the state’s electricity sales.
States on the US border with Canada may import hydropower across the international border, which contributes to
the percentage of renewables in their electricity sales. Vermont, a small state, brings almost three times its domestic
electricity needs into the state from Canada and resells that hydropower to adjacent states (Figure 15).
The Figure 19 map illustrates where states rank in fossil fuel generation and imports. Note that states with a high
percentage of fossil fuels in their energy mix (Indiana, Kentucky, West Virginia) often rank below-average in affordability
metrics, raising questions about claims that traditional generation tends to be more affordable for consumers.
EMISSIONS
Emissions of pollutants into the atmosphere is the most ubiquitous and important pathway through which power
generation affects the environment. Power plants produce many pollutants, but the largest quantities with arguably
the most detrimental effects are from these gases:
•
Carbon dioxide (CO2) is the principal gas causing climate change, and can reduce cognitive function. (Figure 20)
•
Sulfur dioxide (SO2) causes acid rain, asthma attacks and cardiopulmonary diseases. It also is a chemical precursor
to the formation of small particles that cause respiratory problems, miscarriages and birth defects. (Figure 21)
•
Nitrogen oxides (NOx) cause respiratory problems, including wheezing and asthma, as well as numerous other
health problems as a chemical precursor to the formation of small particles and ozone in the air. (Figure 22)
Effects on the environment and human health can be determined by the quantity of pollution released and, in the
cases of sulfur dioxide and nitrogen oxides, by location relative to human population and natural resources. However,
as a measure of overall utility performance, it is most appropriate to also consider “intensity” — emissions per unit of
power generated (Figures 23-25). So, for example, while Texas’s electricity sector produces the most emissions of all
pollutants by a wide margin, its emissions intensity for all pollutants is around the median.
Pollution quantities are in metric tons (approximately 2,200 pounds per metric ton), pollution rates are in metric tons
per gigawatt-hour (million kilowatt-hours) of electricity generated. For the pollution-related gures that follow, lower
numbers signify better performance.

ELECTRIC UTILITY PERFORMANCE: A STATE-BY-STATE DATA REVIEW
23
ENVIRONMENTAL METRICS
TABLE 6: ENVIRONMENTAL RANKINGS (ALPHABETICAL)
State
Carbon Dioxide
Emissions From
the Electricity
Generation per
Gigawatt Hour
Carbon Dioxide
Emissions From
the Electric
Sector
Sulfur Dioxide
and Nitrogen
Oxide Emissions
From Electricity
Generation per
Gigawatt Hour
Sulfur Dioxide
and Nitrogen
Oxide Emissions
From the
Electric Sector
Renewable
Electricity
Generation
Renewable
Generation and
Imports, as a
% of Sales
Clean Electricity
Generation
Clean
Generation and
Imports, as a
% of Sales
Alabama 20 40 18 34 14 22 9 16
Alaska 38 9 46 19 45 17 46 32
Arizona 23 37 18 31 19 23 11 17
Arkansas 35 32 37 36 34 29 23 27
California 8 36 14 29 3 12 3 23
Colorado 41 33 26 23 12 20 29 36
Connecticut 10 12 4 7 48 44 28 14
Delaware 34 6 12 4 50 50 50 50
District of Columbia 42 2 26 1 51 51 51 51
Florida 27 50 16 44 22 45 16 40
Georgia 26 41 29 42 18 34 13 34
Hawaii 47 10 50 25 47 28 48 45
Idaho 3 5 22 10 15 8 30 18
Illinois 18 46 24 43 10 31 2 6
Indiana 48 49 41 46 28 37 38 47
Iowa 31 30 36 33 6 10 15 13
Kansas 28 20 17 17 8 9 17 8
Kentucky 49 45 43 43 35 40 42 48
Louisiana 32 39 39 44 38 47 24 41
Maine 5 3 42 13 27 2 41 10
Maryland 16 14 19 16 41 42 25 31
Massachusetts 25 11 22 10 37 38 45 46
Michigan 33 43 40 47 23 26 14 24
Minnesota 29 25 31 27 13 15 20 19
Mississippi 22 23 19 22 46 46 39 37
Missouri 46 44 45 45 33 36 34 39
Montana 40 17 41 23 17 5 33 5
Nebraska 43 21 45 33 24 19 27 20
Nevada 19 15 19 14 20 16 36 29
New Hampshire 2 4 4 6 42 24 35 1
New Jersey 12 18 7 11 43 48 21 26
New Mexico 39 19 25 15 26 14 37 28
New York 7 22 11 26 5 13 6 12
North Carolina 21 38 31 41 9 27 8 25
North Dakota 44 29 47 35 11 7 26 11
Ohio 37 47 40 48 40 49 22 43
Oklahoma 14 27 14 22 7 11 18 21
Oregon 6 13 18 17 4 6 12 7
Pennsylvania 17 48 20 45 25 41 5 15
Rhode Island 24 7 10 4 49 39 49 49
South Carolina 11 24 14 23 29 35 7 9
South Dakota 9 8 6 6 16 3 32 4
Tennessee 15 26 19 23 21 30 10 22
Texas 30 51 30 51 1 21 1 33
Utah 45 28 37 27 36 25 43 42
Vermont 1 1 21 2 44 1 47 2
Virginia 13 31 17 28 30 43 19 35
Washington 4 16 14 25 2 4 4 3
West Virginia 50 42 40 38 39 32 44 44
Wisconsin 36 34 29 28 32 33 31 38
Wyoming 51 35 45 35 31 18 40 30
Source: EIA

ELECTRIC UTILITY PERFORMANCE: A STATE-BY-STATE DATA REVIEW
24
ENVIRONMENTAL METRICS
TABLE 7: ENVIRONMENTAL RANKINGS (BEST-TO-WORST)
Rank Based on
Average
Performance State
Carbon Dioxide
Emissions From
the Electricity
Generation per
Gigawatt Hour
Carbon Dioxide
Emissions From
the Electric
Sector
Sulfur Dioxide and
Nitrogen Oxide
Emissions From
Electricity
Generation per
Gigawatt Hour
Sulfur Dioxide and
Nitrogen Oxide
Emissions From
the Electric
Sector
Renewable
Electricity
Generation
Renewable
Generation
and Imports,
as a % of
Sales
Clean
Electricity
Generation
Clean
Generation
and Imports,
as a % of
Sales
1 Washington 4 16 14 25 2 4 4 3
2 Oregon 6 13 18 17 4 6 12 7
3 South Dakota 9 8 6 6 16 3 32 4
4 New York 7 22 11 26 5 13 6 12
5 Idaho 3 5 22 10 15 8 30 18
6 New Hampshire 2 4 4 6 42 24 35 1
7 Vermont 1 1 21 2 44 1 47 2
8 Kansas 28 20 17 17 8 9 17 8
9 California 8 36 14 29 3 12 3 23
10 Oklahoma 14 27 14 22 7 11 18 21
11 Maine 5 3 42 13 27 2 41 10
12 South Carolina 11 24 14 23 29 35 7 9
13 Tennessee 15 26 19 23 21 30 10 22
14 Connecticut 10 12 4 7 48 44 28 14
15 Nevada 19 15 19 14 20 16 36 29
16 Alabama 20 40 18 34 14 22 9 16
17 Iowa 31 30 36 33 6 10 15 13
18 Arizona 23 37 18 31 19 23 11 17
19 Minnesota 29 25 31 27 13 15 20 19
20 Illinois 18 46 24 43 10 31 2 6
21 Montana 40 17 41 23 17 5 33 5
22 New Jersey 12 18 7 11 43 48 21 26
23 North Carolina 21 38 31 41 9 27 8 25
24 New Mexico 39 19 25 15 26 14 37 28
25 Maryland 16 14 19 16 41 42 25 31
26 North Dakota 44 29 47 35 11 7 26 11
27 Pennsylvania 17 48 20 45 25 41 5 15
28 Virginia 13 31 17 28 30 43 19 35
29 Texas 30 51 30 51 1 21 1 33
30 Colorado 41 33 26 23 12 20 29 36
31 Rhode Island 24 7 10 4 49 39 49 49
32 Nebraska 43 21 45 33 24 19 27 20
33 Massachusetts 25 11 22 10 37 38 45 46
34 Georgia 26 41 29 42 18 34 13 34
35 Michigan 33 43 40 47 23 26 14 24
36 Alaska 38 9 46 19 45 17 46 32
37 Arkansas 35 32 37 36 34 29 23 27
38 Mississippi 22 23 19 22 46 46 39 37
39 Delaware 34 6 12 4 50 50 50 50
40 Florida 27 50 16 44 22 45 16 40
41 Wisconsin 36 34 29 28 32 33 31 38
42 District of Columbia 42 2 26 1 51 51 51 51
43 Utah 45 28 37 27 36 25 43 42
44 Wyoming 51 35 45 35 31 18 40 30
45 Hawaii 47 10 50 25 47 28 48 45
46 Louisiana 32 39 39 44 38 47 24 41
47 Missouri 46 44 45 45 33 36 34 39
48 Ohio 37 47 40 48 40 49 22 43
49 West Virginia 50 42 40 38 39 32 44 44
50 Indiana 48 49 41 46 28 37 38 47
51 Kentucky 49 45 43 43 35 40 42 48
Source: EIA

ELECTRIC UTILITY PERFORMANCE: A STATE-BY-STATE DATA REVIEW
25
FIGURE 13: 2020 RENEWABLE ELECTRICITY GENERATION, IN TERAWATT-HOURS
0
0
1
1
2
2
2
2
2
3
3
4
4
4
4
5
5
6
6
6
6
7
7
8
8
9
9
10
11
11
11
12
13
14
14
14
15
16
16
16
17
18
19
24
34
35
39
44
83
85
103
020406080100 120
District of Columbia
Delaware
Rhode Island
Connecticut
Hawaii
Mississippi
Alaska
Vermont
New Jersey
New Hampshire
Maryland
Ohio
West Virginia
Louisiana
Massachusetts
Utah
Kentucky
Arkansas
Missouri
Wisconsin
Wyoming
Virginia
South Carolina
Indiana
Maine
New Mexico
Pennsylvania
Nebraska
Michigan
Florida
Tennessee
Nevada
Arizona
Georgia
Montana
South Dakota
Idaho
Alabama
Minnesota
Colorado
North Dakota
Illinois
North Carolina
Kansas
Oklahoma
Iowa
New York
Oregon
California
Washington
Texas
Source: EIA
ENVIRONMENTAL METRICS

ELECTRIC UTILITY PERFORMANCE: A STATE-BY-STATE DATA REVIEW
26
FIGURE 14: 2020 CLEAN ELECTRICITY GENERATION, IN TERAWATT-HOURS
0
0
0
1
2
2
3
4
5
5
6
6
7
7
9
12
12
14
14
14
15
15
16
16
16
17
18
18
20
21
28
30
33
34
34
36
38
39
41
43
45
47
56
58
60
76
84
93
94
118
144
020406080100 120140 160
District of Columbia
Delaware
Rhode Island
Hawaii
Vermont
Alaska
Massachusetts
West Virginia
Utah
Kentucky
Maine
Wyoming
Mississippi
Indiana
New Mexico
Nevada
New Hampshire
Missouri
Montana
South Dakota
Wisconsin
Idaho
Colorado
Connecticut
Nebraska
North Dakota
Maryland
Louisiana
Arkansas
Ohio
New Jersey
Minnesota
Virginia
Oklahoma
Kansas
Florida
Iowa
Michigan
Georgia
Oregon
Arizona
Tennessee
Alabama
North Carolina
South Carolina
New York
Pennsylvania
Washington
California
Illinois
Texas
Source: EIA
ENVIRONMENTAL METRICS

ELECTRIC UTILITY PERFORMANCE: A STATE-BY-STATE DATA REVIEW
27
FIGURE 15: MAP OF 2019 RENEWABLE ELECTRICITY GENERATION AND RENEWABLE IMPORTS,
AS A PERCENTAGE OF SALES
0% 100%
Delaware: 0.9%
District of Columbia: 0.5%
Maryland: 6.0%
15.5%
28.3%
14.9%
10.9%
36.8%
23.5%
4.4%
6.0%
3.3%
7.6%
11.4%
54.2%
10.1%
6.3%
48.6%
48.8%
5.8%
3.0%
84.4%
5.5%
6.1%
11.5%
31.0%
3.2%
6.3%
76.5%
26.7%
29.0%
14.9%
2.5%
32.2%
33.5%
11.5%
64.3%
2.1%
48.1%
72.2%
5.6%
6.9%
78.8%
10.6%
18.3%
12.7%
102.2%
4.9%
76.7%
9.3%
7.9%
28.0%
Source: EIA
FIGURE 16: MAP OF 2019 CLEAN ELECTRICITY GENERATION AND CLEAN IMPORTS,
AS A PERCENTAGE OF SALES
56.6%
27.7%
53.4%
34.4%
40.5%
23.3%
56.9%
12.9%
26.1%
8.6%
52.2%
75.8%
5.9%
57.6%
69.9%
5.4%
12.8%
68.9%
27 .9%
8.3%
39.6%
49.0%
21.3%
17.2%
76.3%
47.8%
28.8%
100.0%
35.0%
32.1%
61.1%
38.5%
64.3%
12.4%
47.6%
70.4%
56.9%
69.2%
78.8%
42.7%
26.7%
12.5%
94.8%
25.0%
84.2%
9.3%
19.5%
28.0%
Delaware: 0.5%
District of Columbia: 0.1%
Maryland: 27.9%
3.0%
0% 100%
Source: EIA
ENVIRONMENTAL METRICS
ELECTRIC UTILITY PERFORMANCE: A STATE-BY-STATE DATA REVIEW
28
FIGURE 17: 2019 RENEWABLE ELECTRICITY GENERATION AND RENEWABLE IMPORTS,
AS A PERCENTAGE OF SALES
1%
1%
2%
3%
3%
3%
3%
4%
5%
6%
6%
6%
6%
6%
6%
6%
7%
8%
8%
9%
10%
11%
11%
11%
12%
12%
13%
15%
15%
16%
18%
24%
27%
28%
28%
29%
31%
32%
34%
37%
48%
49%
49%
54%
64%
72%
77%
77%
79%
84%
102%
0% 20%40% 60% 80%100%120%
District of Columbia
Delaware
Ohio
New Jersey
Louisiana
Mississippi
Florida
Connecticut
Virginia
Maryland
Pennsylvania
Kentucky
Rhode Island
Massachusetts
Indiana
Missouri
South Carolina
Georgia
Wisconsin
West Virginia
Illinois
Tennessee
Arkansas
Hawaii
North Carolina
Michigan
Utah
New Hampshire
Arizona
Alabama
Texas
Colorado
Nebraska
Wyoming
Alaska
Nevada
Minnesota
New Mexico
New York
California
Oklahoma
Iowa
Kansas
Idaho
North Dakota
Oregon
Montana
Washington
South Dakota
Maine
Vermont
Source: EIA
ENVIRONMENTAL METRICS

ELECTRIC UTILITY PERFORMANCE: A STATE-BY-STATE DATA REVIEW
29
FIGURE 18: 2019 CLEAN ELECTRICITY GENERATION AND CLEAN IMPORTS,
AS A PERCENTAGE OF SALES
0%
1%
3%
5%
6%
8%
9%
9%
12%
13%
13%
13%
17%
20%
21%
23%
25%
26%
27%
28%
28%
28%
29%
32%
34%
35%
39%
40%
41%
43%
48%
48%
49%
52%
53%
57%
57%
57%
58%
61%
64%
69%
69%
70%
70%
76%
76%
79%
84%
95%
100%
0% 20%40% 60% 80%100%120%
District of Columbia
Delaware
Rhode Island
Kentucky
Indiana
Massachusetts
Hawaii
West Virginia
Ohio
Utah
Louisiana
Florida
Missouri
Wisconsin
Mississippi
Colorado
Virginia
Georgia
Texas
Alaska
Maryland
Wyoming
Nevada
New Mexico
Arkansas
New Jersey
North Carolina
Michigan
California
Tennessee
Oklahoma
Nebraska
Minnesota
Idaho
Arizona
Alabama
Pennsylvania
Connecticut
Iowa
New York
North Dakota
Maine
South Carolina
Kansas
Oregon
Illinois
Montana
South Dakota
Washington
Vermont
New Hampshire
Source: EIA
ENVIRONMENTAL METRICS

ELECTRIC UTILITY PERFORMANCE: A STATE-BY-STATE DATA REVIEW
30
FIGURE 19: MAP OF 2019 FOSSIL ELECTRICITY GENERATION AND FOSSIL IMPORTS,
AS A PERCENTAGE OF SALES
0% 100%
72.3%
91.4%
21.2%
31.1%
0.0%
0.0%
47.8%
23.7%
67.9%
52.2%
87.5%
71.2%
43.1%
35.7%
72.0%
30.1%
91.7%
76.7%
29.6%
42.4%
90.7%
65.6%
78.7%
51.0%
80.5%
65.0%
94.6%
82.8%
52.4%
30.9%
15.8%
57.3%
46.7%
94.1%
60.4%
87.2%
75.0%
43.4%
61.5%
73.9%
38.9%
87.6%
24.2%
43.1%
87.1%
59.5%
73.3%
96.7%
Delaware: 99.5%
District of Columbia: 99.9%
Maryland: 72.1%
Source: EIA
ENVIRONMENTAL METRICS
ELECTRIC UTILITY PERFORMANCE: A STATE-BY-STATE DATA REVIEW
30

ELECTRIC UTILITY PERFORMANCE: A STATE-BY-STATE DATA REVIEW
31
FIGURE 20: 2019 CARBON DIOXIDE EMISSIONS FROM THE ELECTRIC SECTOR,
IN MILLIONS OF METRIC TONS
218
99
78
77
68
63
59
58
57
57
51
51
48
47
44
41
39
35
34
33
30
29
29
28
28
27
25
25
25
25
24
21
20
19
16
15
14
13
11
10
9
7
3
3
3
3
2
2
2
0
0
050100 150200
250
Texas
Florida
Indiana
Pennsylvania
Ohio
Illinois
Kentucky
Missouri
Michigan
West Virginia
Georgia
Alabama
Louisiana
North Carolina
Arizona
California
Wyoming
Wisconsin
Colorado
Arkansas
Virginia
Iowa
North Dakota
Utah
Oklahoma
Tennessee
Minnesota
South Carolina
Mississippi
New York
Nebraska
Kansas
New Mexico
New Jersey
Montana
Washington
Nevada
Maryland
Oregon
Connecticut
Massachusetts
Hawaii
Alaska
South Dakota
Rhode Island
Delaware
Idaho
New Hampshire
Maine
District of Columbia
Vermont
Source: EIA
ENVIRONMENTAL METRICS

ELECTRIC UTILITY PERFORMANCE: A STATE-BY-STATE DATA REVIEW
32
FIGURE 21: 2019 SULFUR DIOXIDE EMISSIONS FROM THE ELECTRIC SECTOR,
IN THOUSANDS OF METRIC TONS
142.89
88.27
86.38
81.15
74.31
51.21
48.07
47.94
47.85
44.05
41.78
40.11
37.44
36.64
35.15
31.59
31.21
26.71
26.35
23.39
21.13
18.67
17.73
16.38
16.19
13.26
11.82
11.56
11.02
10.48
8.77
8.70
8.49
8.00
7.35
7.30
4.42
4.35
3.78
3.57
2.89
2.71
1.92
1.40
1.01
0.59
0.39
0.25
0.04
0.03
0.00
020406080100 120140 160
Texas
Ohio
Illinois
Missouri
Michigan
Pennsylvania
Kentucky
Georgia
Arkansas
Indiana
Nebraska
Florida
Louisiana
North Carolina
West Virginia
Alabama
North Dakota
Iowa
Wyoming
Tennessee
South Carolina
Washington
Hawaii
Wisconsin
Minnesota
Virginia
Mississippi
Montana
Arizona
Colorado
Maryland
Oklahoma
Utah
New York
Maine
Oregon
Kansas
Nevada
New Mexico
Idaho
Alaska
New Jersey
Massachusetts
California
South Dakota
New Hampshire
Connecticut
Delaware
Rhode Island
Vermont
District of Columbia
Source: EIA
ENVIRONMENTAL METRICS

ELECTRIC UTILITY PERFORMANCE: A STATE-BY-STATE DATA REVIEW
33
FIGURE 22: 2019 NITROGEN OXIDE EMISSIONS FROM THE ELECTRIC SECTOR,
IN THOUSANDS OF METRIC TONS
163.06
63.41
62.28
58.71
51.32
51.28
50.38
46.06
45.37
42.22
39.64
39.60
33.59
33.54
32.53
32.18
30.72
28.85
26.18
25.84
24.32
21.98
21.81
21.68
21.32
20.06
19.88
19.52
18.57
17.10
16.93
16.19
15.76
15.46
15.10
14 .93
13.24
11.65
10.74
10.19
7.70
7.24
5.48
5.40
4.50
1.85
1.82
1.42
1.23
1.19
0.54
020406080100 120140 160180
Texas
California
Indiana
Louisiana
Florida
Michigan
Ohio
North Carolina
Pennsylvania
Missouri
Kentucky
Georgia
Arizona
West Virginia
Illinois
Wyoming
Utah
North Dakota
New York
Alabama
Iowa
Virginia
Arkansas
Wisconsin
Minnesota
Alaska
Nebraska
Colorado
Oklahoma
Montana
Hawaii
Washington
Mississippi
Kansas
Oregon
New Mexico
South Carolina
Tennessee
Nevada
New Jersey
Massachusetts
Maryland
Maine
Connecticut
Idaho
New Hampshire
Rhode Island
South Dakota
Delaware
Vermont
District of Columbia
Source: EIA
ENVIRONMENTAL METRICS
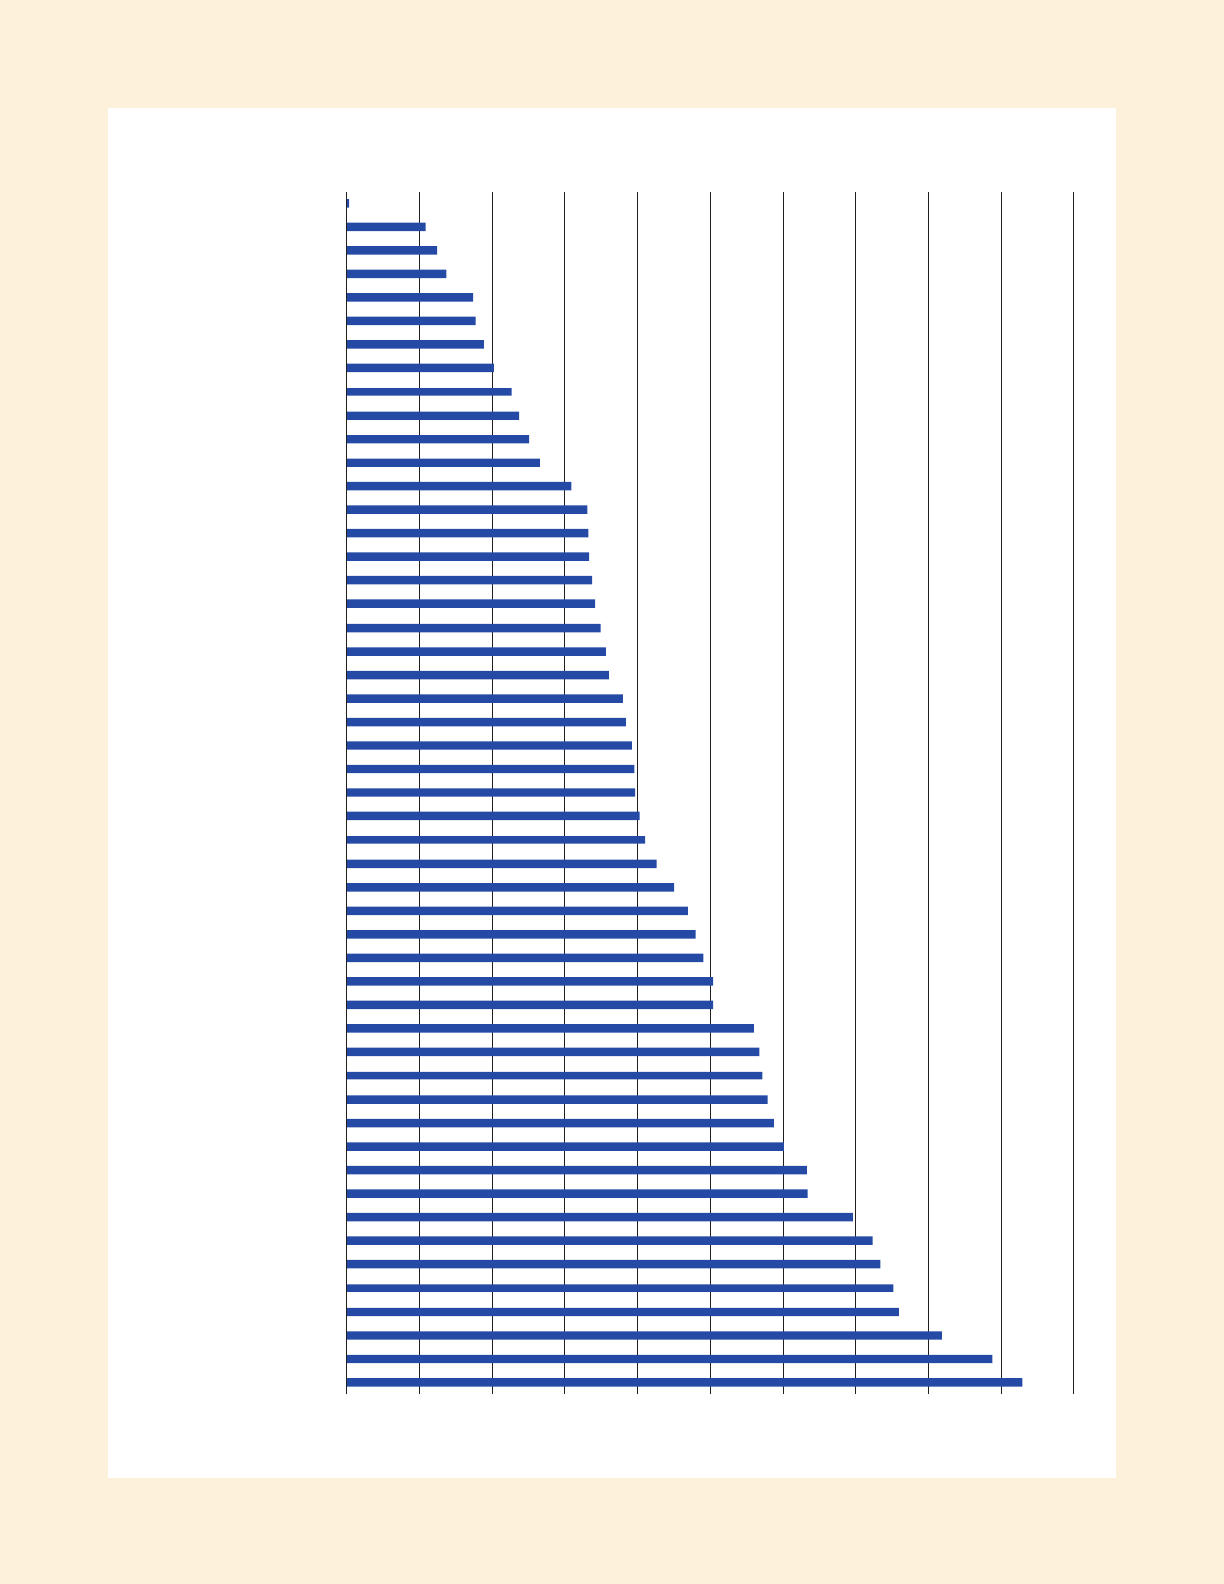
ELECTRIC UTILITY PERFORMANCE: A STATE-BY-STATE DATA REVIEW
34
FIGURE 23: 2019 CARBON DIOXIDE EMISSIONS FROM ELECTRICITY GENERATION,
IN METRIC TONS PER GIGAWATT-HOUR
930
889
819
759
753
735
724
697
634
633
602
588
580
572
568
560
505
504
490
480
470
450
426
410
403
397
396
393
384
379
361
356
349
342
338
333
332
331
309
266
251
238
227
203
188
177
174
137
125
108
3
0100 200300 400500 600700 800900 1,000
Wyoming
West Virginia
Kentucky
Indiana
Hawaii
Missouri
Utah
North Dakota
Nebraska
District of Columbia
Colorado
Montana
New Mexico
Alaska
Ohio
Wisconsin
Arkansas
Delaware
Michigan
Louisiana
Iowa
Texas
Minnesota
Kansas
Florida
Georgia
Massachusetts
Rhode Island
Arizona
Mississippi
North Carolina
Alabama
Nevada
Illinois
Pennsylvania
Maryland
Tennessee
Oklahoma
Virginia
New Jersey
South Carolina
Connecticut
South Dakota
California
New York
Oregon
Maine
Washington
Idaho
New Hampshire
Vermont
Source: EIA
ENVIRONMENTAL METRICS
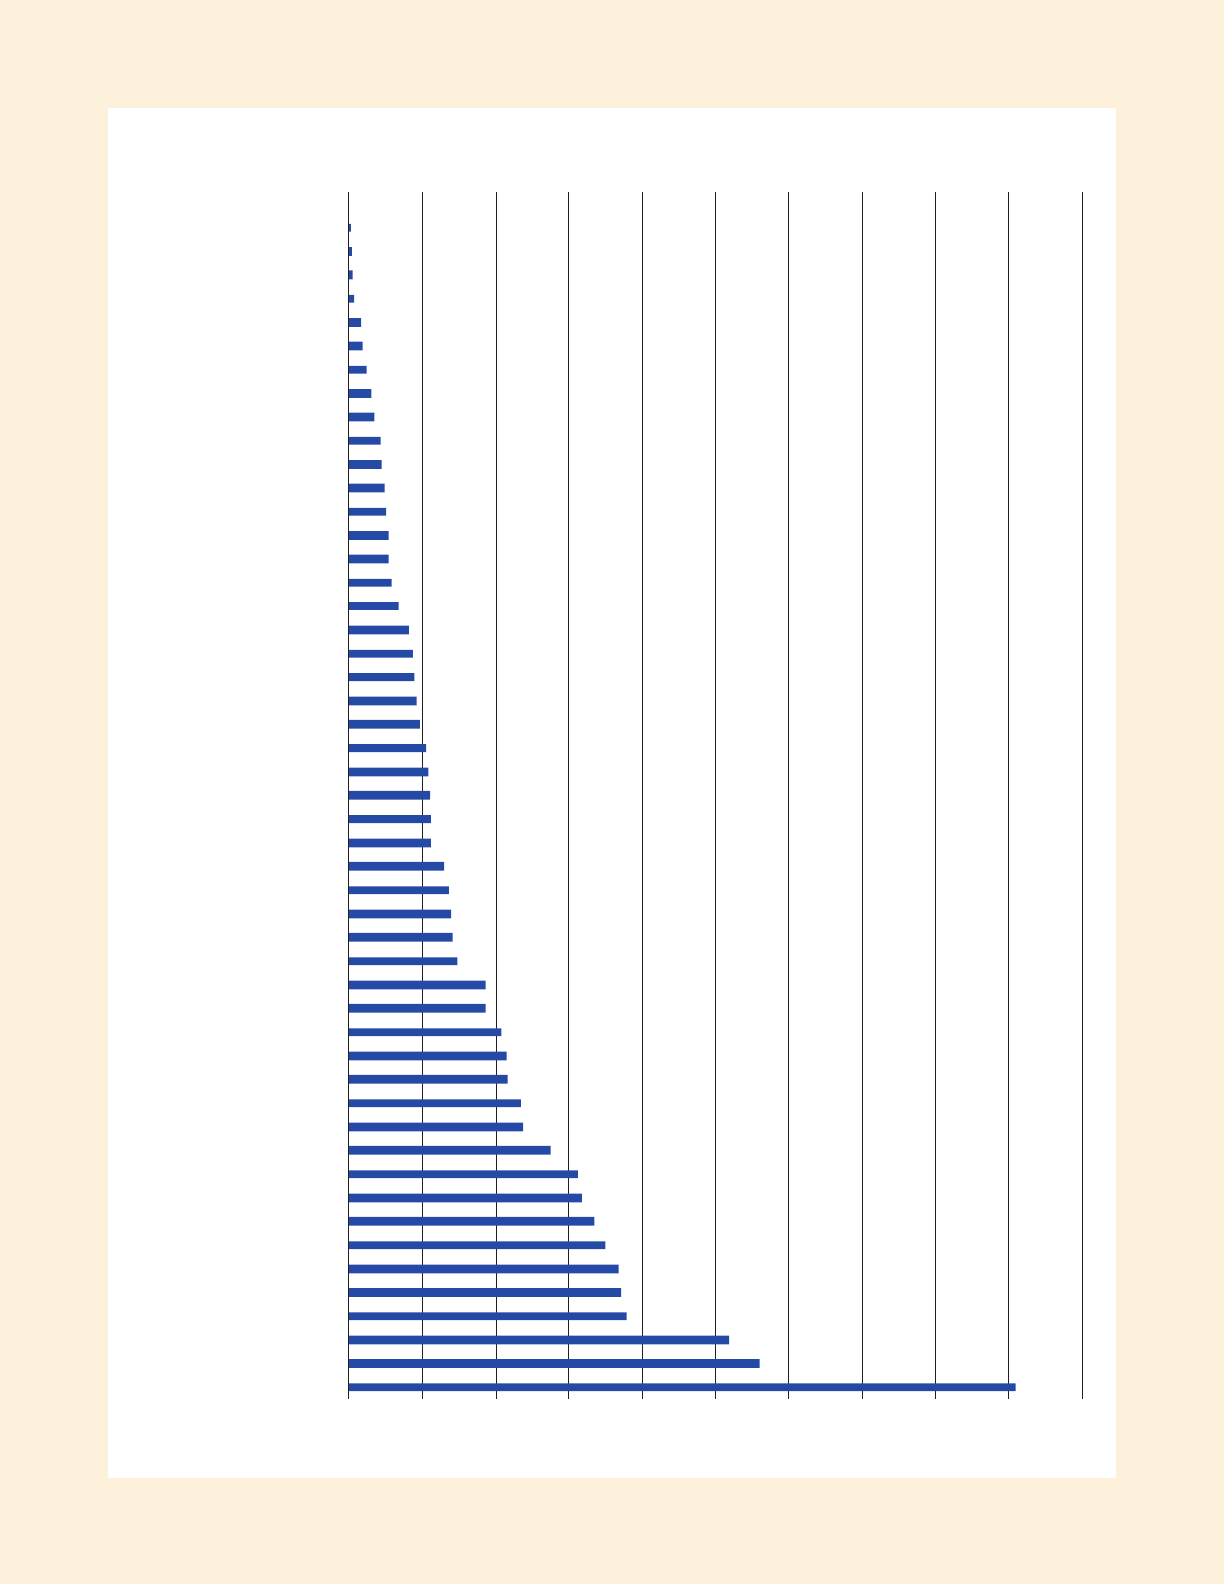
ELECTRIC UTILITY PERFORMANCE: A STATE-BY-STATE DATA REVIEW
35
FIGURE 24: 2019 SULFUR DIOXIDE EMISSIONS FROM ELECTRICITY GENERATION,
IN METRIC TONS PER GIGAWATT-HOUR
1.82
1.12
1.04
0.76
0.74
0.74
0.70
0.67
0.64
0.63
0.55
0.48
0.47
0.43
0.43
0.42
0.37
0.37
0.30
0.28
0.28
0.27
0.26
0.22
0.22
0.22
0.22
0.21
0.19
0.19
0.18
0.18
0.16
0.14
0.12
0.11
0.11
0.10
0.10
0.09
0.09
0.07
0.06
0.05
0.04
0.03
0.01
0.01
0.01
0.01
0.00
0.0 0.20.4 0.60.8 1.01.2 1.41.6 1.8 2.0
Hawaii
Nebraska
Missouri
North Dakota
Arkansas
Ohio
Maine
Kentucky
Michigan
Wyoming
West Virginia
Alaska
Illinois
Iowa
Indiana
Montana
Louisiana
Georgia
Texas
Tennessee
North Carolina
Minnesota
Wisconsin
Pennsylvania
Maryland
Alabama
Utah
South Carolina
Idaho
Colorado
Mississippi
Washington
Florida
Virginia
Oregon
Nevada
New Mexico
Oklahoma
Arizona
Massachusetts
Kansas
South Dakota
New York
Delaware
New Jersey
New Hampshire
Vermont
Connecticut
California
Rhode Island
District of Columbia
Source: EIA
ENVIRONMENTAL METRICS

ELECTRIC UTILITY PERFORMANCE: A STATE-BY-STATE DATA REVIEW
36
FIGURE 25: 2019 NITROGEN OXIDE EMISSIONS FROM ELECTRICITY GENERATION,
IN METRIC TONS PER GIGAWATT-HOUR
3.30
3.10
1.74
0.79
0.76
0.70
0.62
0.61
0.59
0.55
0.54
0.53
0.52
0.52
0.52
0.44
0.42
0.42
0.39
0.36
0.36
0.35
0.35
0.35
0.34
0.34
0.31
0.31
0.30
0.30
0.27
0.24
0.24
0.24
0.24
0.23
0.23
0.22
0.21
0.20
0.20
0.18
0.18
0.18
0.15
0.14
0.14
0.13
0.13
0.10
0.10
0.0 0.51.0 1.5 2.0 2.53.0 3.5
Alaska
District of Columbia
Hawaii
Utah
Wyoming
North Dakota
Montana
Indiana
Louisiana
Kentucky
Missouri
Nebraska
West Virginia
Maine
Vermont
Michigan
New Mexico
Ohio
Iowa
Minnesota
Massachusetts
North Carolina
Colorado
Wisconsin
Arkansas
Texas
California
Georgia
Kansas
Arizona
Nevada
Idaho
Oregon
Rhode Island
Mississippi
Delaware
Virginia
Oklahoma
Florida
New York
Pennsylvania
Maryland
Alabama
Illinois
Washington
New Jersey
Tennessee
Connecticut
South Carolina
New Hampshire
South Dakota
Source: EIA
ENVIRONMENTAL METRICS

ELECTRIC UTILITY PERFORMANCE: A STATE-BY-STATE DATA REVIEW
37
Conclusion
Economist Steven Levitt describes data as “one of the most powerful mechanisms for telling stories,” and the value of
“Electric Utility Performance: A State-by-State Data Review” is in the questions it raises about each state’s energy
story and the overall narrative for the country for affordability, reliability and environmental performance. This report
must be a springboard for further discussion and analysis from regulators, policymakers, consumer advocates and all
players so that we can better identify our energy problems and solutions.
The Citizens Utility Board (CUB) looks forward to producing future econometric analyses to further explain the
utility-performance data set presented in these pages. Our initial review of the report’s ndings does raise some
intriguing questions.
Why do the data in this report fail to support claims by critics of clean energy that fossil fuels are less
expensive for consumers? In fact, West Virginia and other states associated with coal-red power tend to rank
poorly in customer affordability —likely reecting market trends that have pushed the cost of fossil fuels up as the
price tag for renewables declines.
Why are some states that invested heavily in grid modernization not also achieving favorable reliability
rankings? For example, while Florida and Michigan have both launched Advanced Metering Infrastructure (AMI)
power grid upgrades, Florida has relatively strong reliability rankings, while Michigan struggles with reliability. The
metrics indicate that while AMI has great potential to improve the lives of energy customers, it is only one piece to the
puzzle, and can’t alone x the nation’s reliability challenges.
There are a plethora of additional questions that arise from the data, and CUB hopes this report rst sparks lively
discussion and then earnest study. Finding answers is vital as we wrestle with a two-headed beast, trying to solve for
both catastrophic climate change as well as energy burden. The solutions will never come easy and will require
sometimes heated discussion among consumer advocates and policymakers. But when it comes to the climate and
our power bills, the costliest option is inaction. We hope this report helps individual states and the country move a
step closer to a clean and affordable energy future.
ELECTRIC UTILITY PERFORMANCE: A STATE-BY-STATE DATA REVIEW
37

Citizens Utility Board
309 W. Washington, Suite 800
Chicago, IL 60606
www.CitizensUtilityBoard.org
Photo credits: (cover) Freepik.com; (page 1) Oleksii Sidorov/Shutterstock; (page 2) New Africa/Shutterstock; (page 4) skynesher/iStockPhoto;
(page 13) Kuzma/iStockPhoto; (page 30) photostudio/Shutterstock; (page 37) Camp1994/Shutterstock
